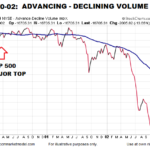
By looking at previous bear markets we can get an idea about how advance/decline volume behaves in bear markets. When the S&P 500 reached a bull/bear tipping point in March 2000, NYSE Advancing – Declining Volume was already waving yellow flags. As shown in the chart below, $NYUD was hugging its 50-week moving average and the 50-week was rolling over in a bearish manner.
Why the Japanese Yen’s Bull Run REALLY Ended
September 12, 2015 by Leave a Comment
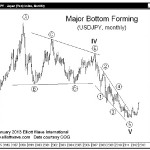
Back in 2012, the yen looked like the strongest monetary unit in the financial universe, standing at an all-time record high against the mighty U.S. dollar, the world’s “reserve” currency. Flash ahead to now (circa September 2015), and the yen is down 30% whilst clinging to its lowest level against the dollar in 12 years. So, what changed?