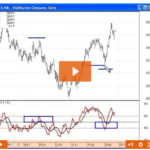
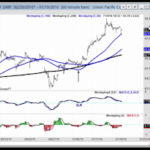
Two of the most commonly used technical indicators of momentum in trading are the moving average convergence divergence, or MACD, and the Relative Strength Index (RSI). Today Jeffrey Kennedy is going to be looking at RSI. It was developed by legendary trader J. Welles Wilder. It is a “momentum oscillator”. As the price of a security rises, price momentum increases. The faster the security rises (the greater the period-over-period price change), the larger the increase in momentum. Once this rise begins to slow, momentum will also slow. Our NYSE ROC chart is a type of Momentum chart.
Top 3 Technical Tools Part 1: Japanese Candlesticks
August 9, 2017 by Leave a Comment
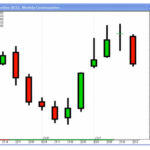
Jeffrey Kennedy to name 3 of his favorite technical tools (besides the Wave Principle). He told me that Japanese candlesticks, RSI, and MACD Indicators are great methods to support Elliott wave trade setups.
Taking the Long View of the Market
July 26, 2017 by Leave a Comment
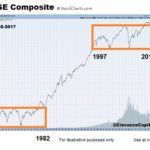
In the following article Chris Ciovacco of Ciovacco Capital Management takes a look at the big picture of the stock market. It is very possible the stock market’s behavior between 2016 and 2034 will be significantly different from its behavior between 1997 and 2015. Therefore, our approach to the markets needs to be flexible enough to handle the possibility of much stronger and sustained trends than what we have seen in our investment lifetimes.
When Prices Are Falling, TWO Numbers Matter Most
July 22, 2017 by Leave a Comment
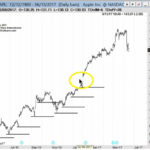
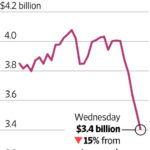
On June 29, the Apple iPhone turned 10 years old. But, for many, the mood surrounding the milestone was less than celebratory. Reason being, in June alone, Apple Inc. (AAPL) plunged 6% to two-month lows amidst a broad-scale bruising of the global tech sector.
SPX CYCLES, FED FUNDS AND GOLD
July 19, 2017 by Leave a Comment
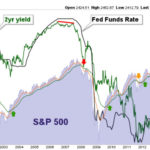
In the following article by Gary Tanashian of Notes from the Rabbit Hole which he refers to as “NFTRH” Gary looks at the 12 month and 30 month S&P 500 cycle, FED Funds and his proprietary Gold “Macrocosm picture” which includes looking at Gold in various currencies. This is important because since gold is an international commodity, if an individual currency is falling it could appear that gold is rising and if a currency is rising (against other currencies) it could appear that gold is falling. So we need to look at gold in terms of a variety of currencies to eliminate the currency exchange issue and determine what gold itself is actually doing rather than gold versus an individual currency.
Trump Bump Slaughters Market Bears
March 8, 2017 by Leave a Comment
Much of the post-US election rally in the stock market has been attributed to President Donald Trump’s promises for tax cuts and deregulation. But long before the election, Elliott wave price patterns already told our subscribers to prepare for a market rally.
Rare Signal Says Stock Rally Is The Real Deal
February 28, 2017 by Leave a Comment
Only Three Other Occurrences Since 2002
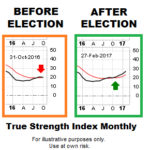
The True Strength Index (TSI) is a momentum oscillator based on a double smoothing of price changes. As shown in the monthly S&P 500 graph below, a positive momentum crossover (black moves above red) has only occurred four times since 2002. In the three previous cases, the S&P 500 rallied for a long period of time after the crossover; the average gain was 52%.
Learning to Recognize Trade Setups with “MACD”
February 2, 2017 by Leave a Comment
According to Investopedia – the Moving Average Convergence Divergence (aka. MACD) is a trend-following momentum indicator that shows the relationship between two moving averages of prices. The MACD is calculated by subtracting the 26-day exponential moving average (EMA) from the 12-day EMA.
Tips for Trading Options with Elliott Waves
November 25, 2016 by Leave a Comment

In this interview, Wayne Gorman, veteran Elliott wave analyst offers tips and strategies for trading options using Elliott Waves.
Is Dow Theory Telling Us The Stock Rally Is Going To Fail?
August 27, 2016 by Leave a Comment
The Dow Jones Transportation Average has failed to print a new high above the previous high made in 2015. Given the Dow has made a new high, a Dow Theory non-confirmation remains in effect.