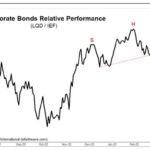
A distinct Head and Shoulders pattern exists where the neckline has been broken over the last few days. The corporate bond market has held in reasonably well over the last year, but we fully expect this sector to be the next shoe to drop.
Euro: Look at This Head & Shoulders Chart Formation
December 23, 2021 by Leave a Comment
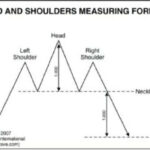
You are probably familiar with the classic “head and shoulders” chart pattern. But, in case you need a refresher, here’s a brief description of a head and shoulders top: The high of an initial upward move is the left shoulder. After a decline, another upward move takes prices to a higher high, or the head. A second decline follows the head. A third rally then takes prices to a peak below the high of the head, and becomes the right shoulder. The left and right shoulders are often similar in duration and extent. A trendline connecting the two lows is called the neckline. When prices penetrate the neckline, a change of trend is believed to have occurred. Head and shoulders bottoms also occur and the same description applies except in reverse. This head and shoulders measuring formula — showing a top as an example — provides even more insight. The commentary is from a past issue of Elliott Wave International’s Trader’s Classroom:
Are Stocks About To Break Out Relative To Fear?- Video
December 23, 2014 by Leave a Comment

The chart above has some common characteristics found in a potentially bullish formation known as an inverse head-and-shoulders pattern. A break of the orange neckline will improve the odds of the current rally in equities carrying quite a bit further.
Learn to Spot a Head & Shoulders Pattern in Your Charts (Video)
October 24, 2013 by Leave a Comment
A Trading Lesson from Elliott Wave International’s Jeffrey Kennedy By Elliott Wave International Senior Analyst Jeffrey Kennedy is the editor of our Elliott Wave Junctures trader education service and one of our most popular instructors. Jeffrey’s primary analytical method is the Elliott Wave Principle, but he also uses several other technical tools to supplement his analysis. […]
Slicing the Neckline: A Classic Technical Pattern Agrees with the Elliott Wave Count
August 17, 2010 by Leave a Comment
In the August issue of his Elliott Wave Theorist, market forecaster Robert Prechter alerted readers that the U.S. stock market was slicing the neckline of a classic head-and-shoulders pattern in technical analysis, and that this may send the market into critical condition. Prechter said that when the Elliott wave count and a head-and-shoulders pattern are […]