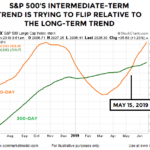
In today’s article Chris Ciovacco looks at several charts with their 100 day and 300 day moving averages and what happens when those averages ‘cross”.
Tools for Technical Analysis
Search This Site
Subscribe NOW!
Never wonder again about whether the new information is out yet. You will be the first to know about the Elliotwave articles, Current Inflation and Unemployment Data and Financial Trend Forecaster Articles.
Plus you will also get the following special report absolutely free: “15 Ways to Beat 95% of All Investors”.
Click Here to SubscribeSearch
Articles by Category
Articles by Date
Disclaimer
Privacy & Terms of Use
Work by editor and author, Tim McMahon, has been featured in Bloomberg, CBS News, Wall Street Journal, Christian Science Monitor, Forbes, Washington Post, Drudge Report, The Atlantic, Business Insider, American Thinker, Lew Rockwell, Huffington Post, Rolling Stone, Oakland Press, Free Republic, Education World, Realty Trac, Reason, Coin News, and Council for Economic Education. Connect with Tim on Google+ Read More…
Copyright © 2025 · Capital Professional Services, LLC · Maintained by Intergalactic Web Designers · Admin
