Educational trading lessons from “Visual Guide to Elliott Wave Trading”
When it comes to improving your wave-based analysis and technical trades, three steps may sound simple enough. Yet if you have any experience trading, you know that nothing about trading is easy.
Senior Analyst Jeffrey Kennedy knows that it takes skill, discipline and courage to execute a successful trade. In the new book he has coauthored with EWI’s Wayne Gorman (now a No.1 Amazon Bestseller), Visual Guide to Elliott Wave Trading, he picks up where Frost and Prechter’s classic textbook Elliott Wave Principle leaves off to give you the perfect blend of traditional textbook analysis and real-world application.
According to Kennedy, there are three key components of a successful trade:
- Analyze the price charts.
- Formulate a trading plan.
- Manage the trade.
Part One: Analyze the Price Charts
When it comes to trade setups, it doesn’t get much easier than the price chart of CAT from April and May 2011. As you can see in Figure 2.1, prices fell in five waves from 116.55 to 108.39. This wave pattern was significant because impulse waves identify the direction of the larger trend. Thus, this five-wave decline in CAT implied further selling to come that would take prices below 108.39 in either wave (C) or wave (3).
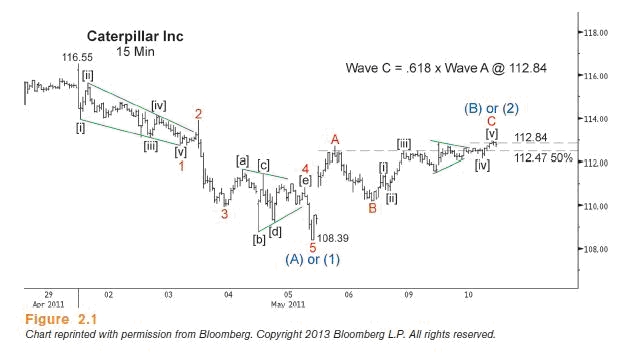
The subsequent rally in CAT that developed in three waves supported this analysis. Countertrend price action typically consists of three waves, so I knew to expect another move down in CAT. Moreover, the three-wave advance in CAT traveled to 112.47 to retrace 50 percent of the previous sell-off. That 50 percent is a common retracement for corrective waves. Also nearby was 112.84, the price level at which wave C equaled a .618 multiple of wave A, which is a common Fibonacci relationship between waves C and A of corrective wave patterns.
The only question at this point was whether the move up from 108.39 should be labeled as wave (B) or wave (2). From a short-term trading perspective, this question was academic because, either way, the trade objective was a price move just under 108.39. A final observation about the corrective rally: The slope of wave C in this case was shallower than the slope of wave A. A shallow wave C slope, which demonstrates a decrease in momentum, is a harbinger that the larger trend is resuming. These shallower slopes within zigzags are so common that they are almost a qualifying characteristic of the pattern.
By applying the most basic Elliott wave analysis to the price chart of CAT, I could see five waves down and three waves up into Fibonacci and structural resistance at 112.47-112.84. That meant that odds strongly favored a sell-off below 108.39 from near current levels. So, the question at that point was how best to capitalize on this information.
Part Two: Formulate a Trading Plan
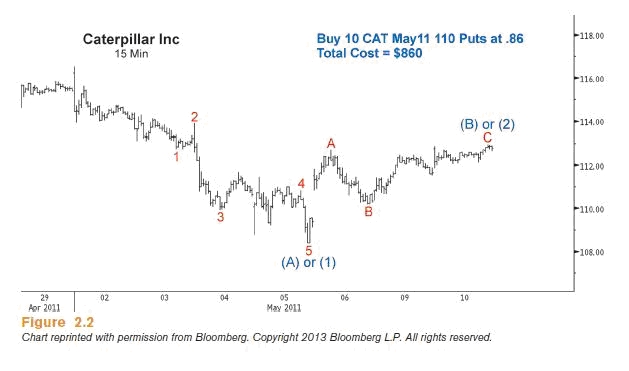 In Figure 2.2, I chose to trade this setup using options, specifically, by purchasing 110 puts on May 10, 2011, at 86 cents apiece. These options were scheduled to expire on May 20, 2011, so there were only eight trading days left on these puts. Considering that these options were to expire in just a matter of days, this kind of trade is extremely risky, and only the most seasoned and risk-aware trader should consider doing it.
Since the initial sell-off in CAT from 116.55 to 108.39 transpired in four days, here was my thinking at the time: If the next wave down proved to be wave (3), then I would see prices fall farther in a shorter period of time; if the upcoming decline proved to be a (C) wave, then the upcoming sell-off would most likely be shallower and take more time. Even if CAT were to unfold in wave (C) and take twice as long as the initial decline, it would still trade roughly at $104.81, the level at which waves (C) and (A) would be equal by options expiration.
Again, it is important to understand that due to waning premium, an options trade should not be taken with the idea of holding the trade over a long period of time for a sizable move down. The idea was simply to catch a short-term move below the May 2011 low of 108.39 over three to five trading days.
Part Three: Manage the trade
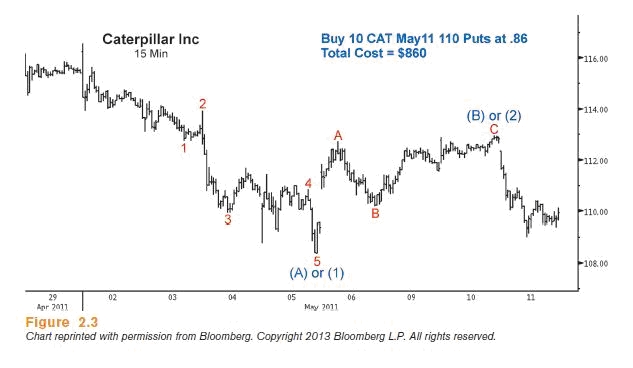
The day following our analysis and entry, CAT fell sharply (see Figure 2.3). As a result, the value of the position increased substantially. In retrospect, it would have been prudent to exit the trade entirely or at least partially the day after the swift decline. However, since the original analysis called for a move below 108.39, I decided to hold the position.
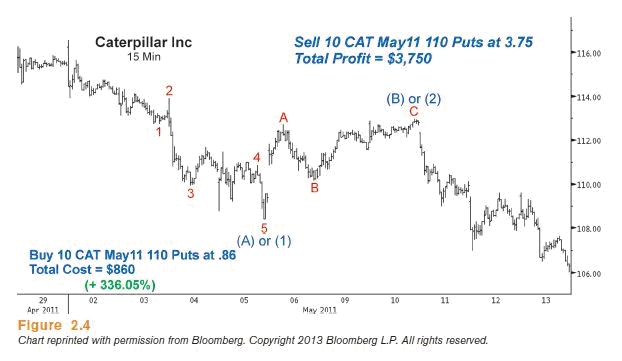
 During the next few days, CAT continued lower. On Friday, May 13, 2011, I exited the position for a 336.05 percent return (see Figure 2.4), selling the options that were originally purchased at 86 cents for $3.75 apiece.
 Yes, the percent return in this trading example is exciting. What is even more exciting, though, was its genesis. This trade began by simply recognizing an impulse wave and a zigzag. It did, however, take some knowledge of Fibonacci ratios and multiples to identify a high-probability reversal zone for CAT’s corrective advance. The final step in this successful trading equation was to use the knowledge derived from the analysis to determine a good way to leverage the information. In this case, we set up an options trade.
 |
The Ultimate Wave Trading Crash CoursePut yourself on the fast track to applying the Elliott Wave Principle successfully with a FREE one-week primer: The Ultimate Wave Trading Crash Course. Learn the basics with 5 FREE trading lessons from EWI Trading Instructor and Senior Analyst Jeffrey Kennedy — including insightful excerpts from his Amazon No. 1 Bestseller, Visual Guide to Elliott Wave Trading.Learn more and start your crash course now >> |
This article was syndicated by Elliott Wave International and was originally published under the headline The 3 Essential Parts of an Elliott Wave Trade [Book Excerpt Part 2 of 3]. EWI is the world’s largest market forecasting firm. Its staff of full-time analysts led by Chartered Market Technician Robert Prechter provides 24-hour-a-day market analysis to institutional and private investors around the world.
See Also:
- What is the Yield Curve and What Others Are Saying About It
- The 2 Most Important Keys to Successful Trading
- S&P Final Wave Up?


Speak Your Mind