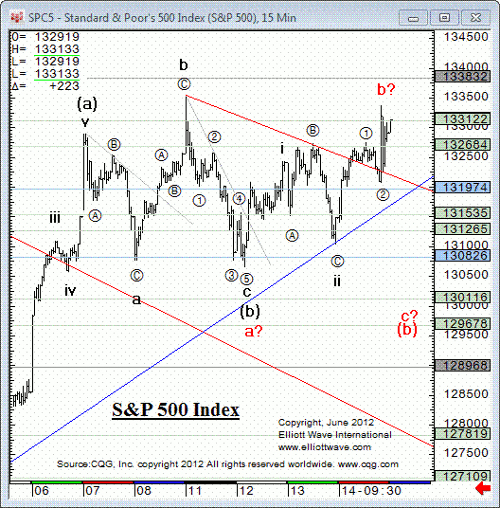
Here’s what Elliott wave analysis is all about: You study charts to find non-overlapping 5-wave moves (trend-defining) from overlapping 3-wave ones (corrective, countertrend).
With that in mind, please take a look at this chart of the S&P 500. Immediately, you can see that the S&P 500 has been moving sideways in a choppy, overlapping manner. That’s the definition of a correction — i.e., that is NOT the trend. The trend, as the U.S. Intraday Stocks Specialty Service editor Tom Prindaville said in the morning market overview, was higher — at least in the short-term:
…sideways-to-up over the very near term will be expected. Simply put, overall higher near-term remains the intraday call — to complete a corrective second wave.
Market corrections — are notoriously hard to forecast.
But from an Elliott wave perspective, there was a good reason for the June 15 rally June 19, 2012
S&P 500: Did the 13.74-Point Rally Finish the Move?
By Elliott Wave International
There were few “fundamental” reasons to be bullish on U.S. stocks on Friday morning (June 15).
If anything, the news that the U.S. unemployment rose in 18 states in May sounded downright bearish. But stocks rallied anyway — for a seemingly unlikely reason, explained the pundits: Because all the bad news lately makes it likely that the Fed will step in again.
(Just as a side note, how many times did the Fed “step in” in 2007-2009 while the DJIA was dropping from over 14,000 to below 6,500? But hey, that’s ancient history, and besides — “it’s different this time,” right?)
From an Elliott wave perspective, there was another reason for the June 15 rally: the S&P 500 had some unfinished technical business on the upside. Here’s what the editor Tom Prindaville wrote on Friday morning in EWI’s U.S. Intraday Stocks Specialty Service (try it free now, during June 14-21 FreeWeek):
S&P 500 (Intraday)Posted On: Jun 15 2012 9:30AM ET / Jun 15 2012 1:30PM GMT Last Price: 1331.33
Trade pushed beyond the 1319.74 level yesterday…[which] is significant because it implies that, minimally, the S&P wants to take a closer, more deliberate look at 1338, and the overall proportionally of the recent Elliott wave action backs that up. For today, persistence atop 1319.74 is needed to see the very near-term trend up with a minimum upside target of 1338.32.

See Also:
S&P 500: Elliott Wave Forecasts, Simplified
Learn to Identify High Probability Trading Opportunities Using Price Bars and Chart Patterns
Speak Your Mind