With bitcoin’s ups and downs stealing the spotlight lately, it’s easy to forget about gold and silver, the traditional “stores of value.” Meanwhile, action in precious metals has been quite lively lately, as well. For example, on January 6, the price of silver hit an intraday high of $27.97 and then took a swift slide. Here’s what the Elliott Wave has to say about it. ~ Tim McMahon, editor.
This Is How You Could’ve Spotted the Start of Silver’s Price Slide
Setting Elliott wave price targets brings these two advantages
By Elliott Wave International
If you’re a close observer of the metals market, you know that the price of silver has taken a tumble during the past several days.
Elliott wave analysis was a big help in identifying the price turn, which occurred on Jan. 6.
Indeed, here’s a chart and commentary from the Jan. 6 issue of our Monday-Wednesday-Friday U.S. Short Term Update, an Elliott Wave International publication which provides near-term forecasts for major U.S. financial markets:
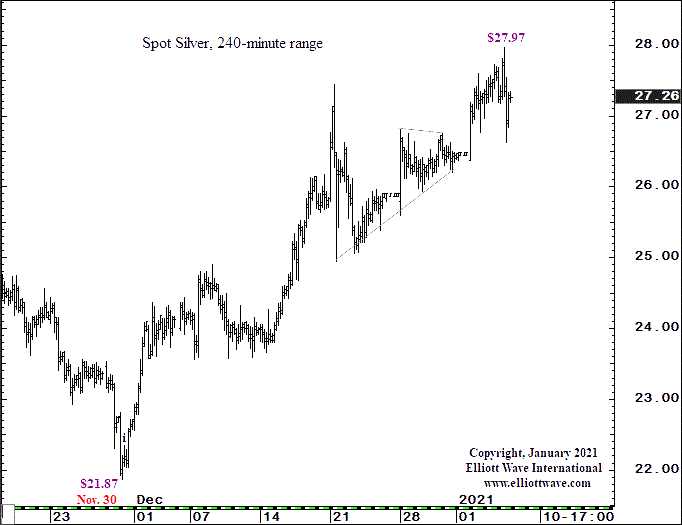
[Silver]’s rally to $27.97, this morning’s high, completes [the upward wave at two degrees of trend]… Today’s high met the $27.88-$28.29 range that was cited in the prior Updates and the Daily Sentiment Index (trade-futures.com) has jumped to 90%. Silver should now be in the early stages of a decline…
Speaking of a target range for prices, here’s what the Wall Street classic, Elliott Wave Principle: Key to Market Behavior, had to say:
One advantage of setting a target is that it gives a sort of backdrop against which to monitor the market’s actual path. This way, you are alerted quickly when something is wrong and can shift your interpretation to a more appropriate one if the market does not do what you expect. The second advantage of choosing a target well in advance is that it prepares you psychologically for buying when others are selling out in despair, and selling when others are buying confidently in a euphoric environment.
Now, getting back to that Jan. 6 U.S. Short Term Update forecast that “silver should now be in the early stages of a decline,” that indeed turned out to be the case.
By the close of trading on Jan. 8, the price of silver had tumbled 12.4% in just three days.
On Jan. 11, the U.S. Short Term Update provided further clarity on the anticipated Elliott wave path of silver prices.
Many investors tend to linearly extrapolate existing trends into the future. However, the Elliott wave model helps an investor to anticipate change.
Elliott Wave International’s experts have studied the stock indexes for decades, and here’s what they’ve learned: Chart patterns repeat themselves at every degree of trend. That means the stock market’s trends and turns are predictable.
The record shows that EWI kept subscribers ahead of the volatility that began in the early weeks of 2020. Now get ready for 2021.
Learn what these Elliott wave experts expect next — FREE — in the State of the U.S. Markets FreePass, now through February 3, 2021.
This article was syndicated by Elliott Wave International and was originally published under the headline This Is How You Could’ve Spotted the Start of Silver’s Price Slide. EWI is the world’s largest market forecasting firm. Its staff of full-time analysts led by Chartered Market Technician Robert Prechter provides 24-hour-a-day market analysis to institutional and private investors around the world.
Speak Your Mind