Technical Analysis-
Despite the fancy and sophisticated tools it employs, technical analysis at its very core is a study of the market’s supply and demand to determine the price movement of a stock or other underlying asset in the future. Technical analysis premise rests on 3 theorems:
- The market discounts everything.
- An asset’s price moves in trends.
- History tends to repeat itself in terms of price movements.
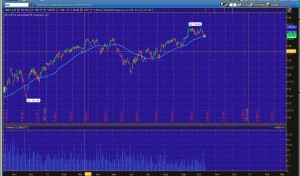
 The main tool used in technical analysis is an asset’s (stocks, currencies, commodities) chart. A chart is simply the graphical representation of the price movement of a particular asset in a specified time frame. When a technical analyst looks at a chart, he usually looks for the overall trend; support and resistance; momentum; and buying/selling pressure.
- Overall trend – refers to the direction in which the market or asset’s price is moving. It could be moving up, down or sideways.
- Support – the price level in which many traders are willing to buy the stock.
- Resistance – the price level in which many traders are willing to sell the stock. Both support and resistance levels are used to determine whether a trend is reversing.
- Momentum – refers to the comparison of the current stock’s price to its price in the previous trading periods. This is often used as a buy/sell indicator by some traders.
An asset’s chart features many indicators which are used in technical analysis. Indicators are used to confirm trends, momentum, and volatility; all of which are used to form buy/sell signals which aids a trader in making solid trading decisions. Here are some examples of common indicators used in stocks trading:
- Moving average convergence divergence (MACD) – this show the relationship between two moving averages of a stock’s price. This indicator is used to signal whether the stock’s trend is bearish, bullish; or the trend is about to end. The MACD is calculated by subtracting the 26-day exponential moving average from the 12-day exponential moving average.
- Relative Strength Index (RSI) – one of the most popular momentum indicators used by traders. It is used to determine whether there is overbuying or overselling of a stock. The standard measurement of a stock’s RSI is 14 days. An RSI of more than 70 indicate that the stock is overbought; while an RSI of below 30 indicate that the stock is oversold. In both cases, a reversal may be on the way since the stock’s price has been pushed to unreasonable levels.
- Stochastic Oscillator – this indicator signals uptrend or downtrend momentum. In an upward momentum the price closes near the highs of a range; while in a downward momentum, the price closes near the lows of the trading range.
- On-balance Volume – an indicator which reflects the movement of volume. If the stock’s price moves up within a trading period, the total volume is assigned as positive; if it moves down, it is assigned as negative.
- Accumulation/Distribution Line – this indicator measure the ratio of buying and selling of a certain stocks by comparing the volume and price movement of a stock within a specified period. If the accumulation/distribution line is trending up, it’s a sign that there is more buying compared to selling.
Technical analysis goes into in-depth quantitative study of historical data in an attempt to determine the direction of the market in the future. And while it involves varying levels of risks, such analysis can used to devise trading systems that’s set to stack the odds in your favor.
About the Author:
Guest Post contributed by Patrik Fonce. Patrik is a trader with more than 10 years of experience trading financial markets. He is also a writer and works currently at QuantShare Trading Software.
[…] Technical Analysis « Moving Averages and the Elliott Wave Principle […]