What is the Yield Curve?
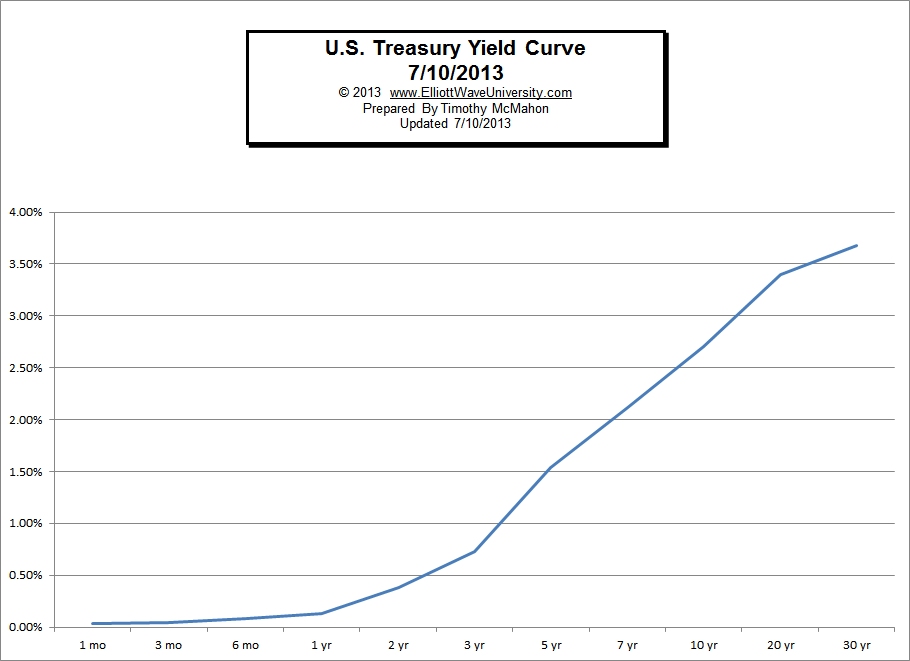
The yield curve is a graphical representation of several “yields” or interest rates over varying contract lengths i.e. 1 month, 2 months, 3 months, 1 year, 2 years, 10 years, etc… The curve shows the relationship between the interest rate or cost of borrowing and the time to maturity. For example, interest rates paid on U.S. Treasury securities for various maturities are closely watched by many traders, and are commonly plotted on a graph such as the one on the right which is informally called “the yield curve.”
In the above yield curve for July 10th, 2013 we see that the interest rate gradually rises from a very low rate of 0.03% APR on a 1 month T-Bill to 3.68% APR on a 30 year Treasury Note. By looking at the shape of the curve we can learn quite a bit about the state of the Treasury market. We can see that overall interest rates are low with short term money yielding almost nothing and even over 30 years the rate is only 3.68%. This means that investors are relatively complacent and are not factoring in much in the way of risk over the next 30 years. Since over the long term (since 1913) inflation has averaged 3.22% that 3.68% doesn’t leave much room for error and a lot can happen in 30 years.
Operation Twist’s Effect on the Yield Curve
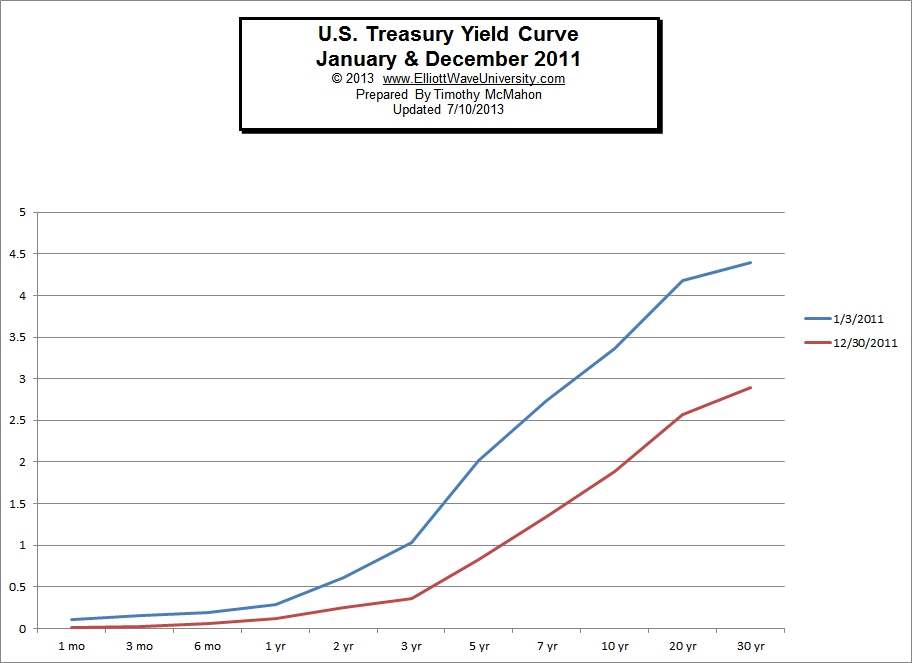
Operation Twist was a plan for the FED to purchase $400 billion of bonds with maturities of 6 to 30 years and to sell bonds with maturities less than 3 years. The intent was to drive down long term rates to help the housing industry. In the chart below we can see the difference before and after operation twist began.
What Others are Saying About the Yield Curve
Lance Jepson, editor of Guerilla Stock Trading in his article Have Central Banks Lost Control Of the Yield Curve? says that even though the FED was able to reduce rates in 2011 that control is beginning to wane because “Investors see the risk of default rising as the debt bubble in the U.S. has ballooned out of control.” Jepson says a similar thing is happening in Japan where “Japan’s 10 year bond yields are up about 200% since the April low of 0.3% to the close on Friday of 0.89%!” He also says, “China has lost control of the yield curve because of a shadow banking system that is being used to circumvent monetary policy coming from the central bank.” So according to Jepson it is possible that the Central banks are beginning to lose control of interest rates and that interest rates will begin to climb (after all they can’t lower the Federal Funds Rate below Zero so the FED is basically out of bullets when it comes to interest rates) so the only tool they have is printing money which can spook the market and cause interest rates to rise, which causes bond prices to fall. Recently just the thought that the FED might raise interest rates caused massive carnage in the stock market.
Market Watch is expecting Brazil to raise interest rates and have reported a growing differential between long-term and short-term rates with long-term rates increasing while short-term rates have actually been falling.
Bloomberg says, that on May 21 for the first time since June 2010, Greece’s yield curve has normalized after being inverted. (An inverted yield curve is when short-term rates are higher than longer-term rates. According to Bloomberg, “Greece’s 10-year yield fell below the rate on its 30-year securities last week for the first time in almost three years, adding to signs the bond market in the nation that triggered the euro region’s debt crisis is healing.”
According to Credit Writedowns “China’s short-term rates have stabilized but the yield curve remains inverted” Chinese short term rates are at 4.75% while 5 year rates are just below 4.1% and 10 year rates are 4.2%. Previously short term rates were over 4.9%.
See Also:
- Will Raising Interest Rates Give Us a High Probability Short?
- Navigating A Fed-Dependent Market
- Non-Traditional View of the Markets
- The 12 Rules to Follow for Buying Dividend Paying Stocks


Speak Your Mind