Notice the similar pattern between these two bond charts
By Elliott Wave International
Financial advisors have long advocated a mix of 60% stocks / 40% bonds to cushion portfolios from downturns in the stock market.
The thinking is that stocks go up in the long-term, hence, that’s where investors should allocate the most. At the same time, advisors acknowledge that stock prices can sometimes go down so “less risky” bonds will provide at least some protection.
The problem with this investment strategy is that bonds can go into bear markets too. Moreover, they can do so at the same time as stocks.
Let’s review what happened during the Great Depression of the early 1930s. Here’s a chart and commentary from Robert Prechter’s 2021 Last Chance to Conquer the Crash:
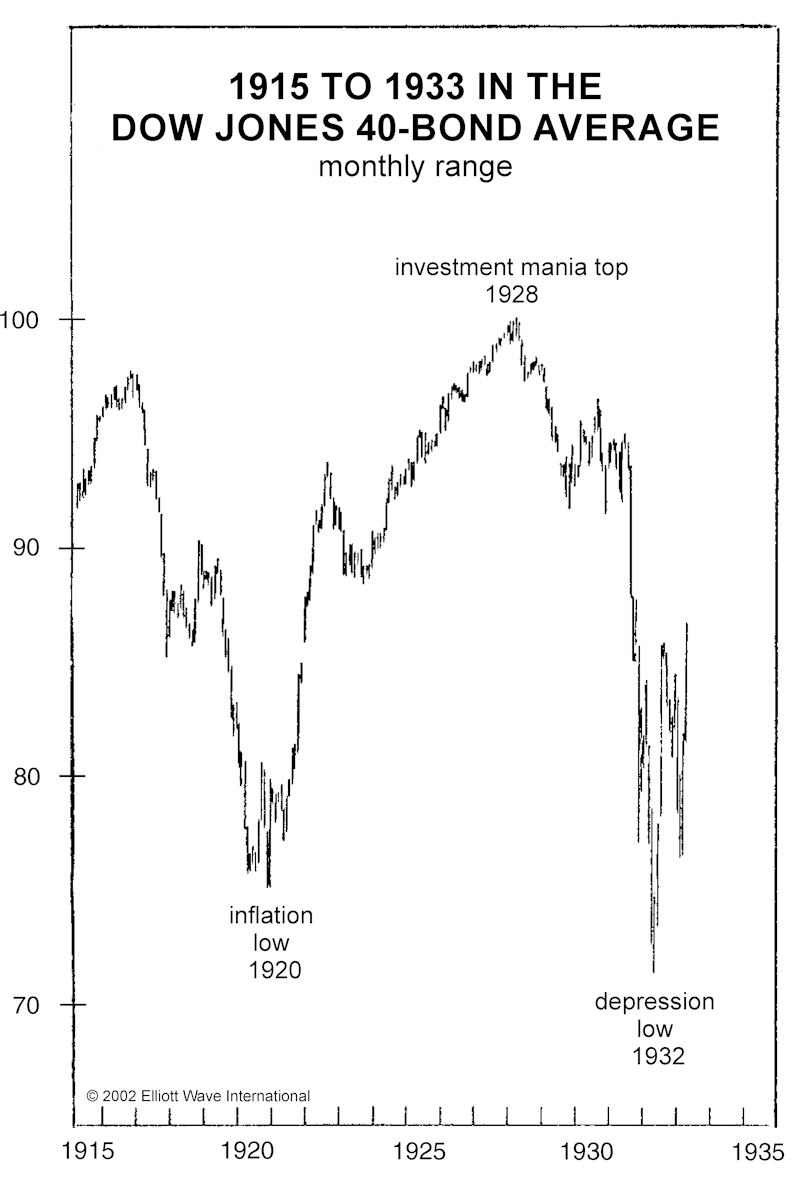
The chart shows what happened to the Dow Jones 40-bond average, which lost 30% of its value in four years. Observe that the collapse of the early 1930s brought these bonds’ prices below — and their interest rates above — where they were in 1920 near the peak in the intense inflation of the ‘Teens.
Now, let’s review more recent history. Here’s another chart and commentary from the book:
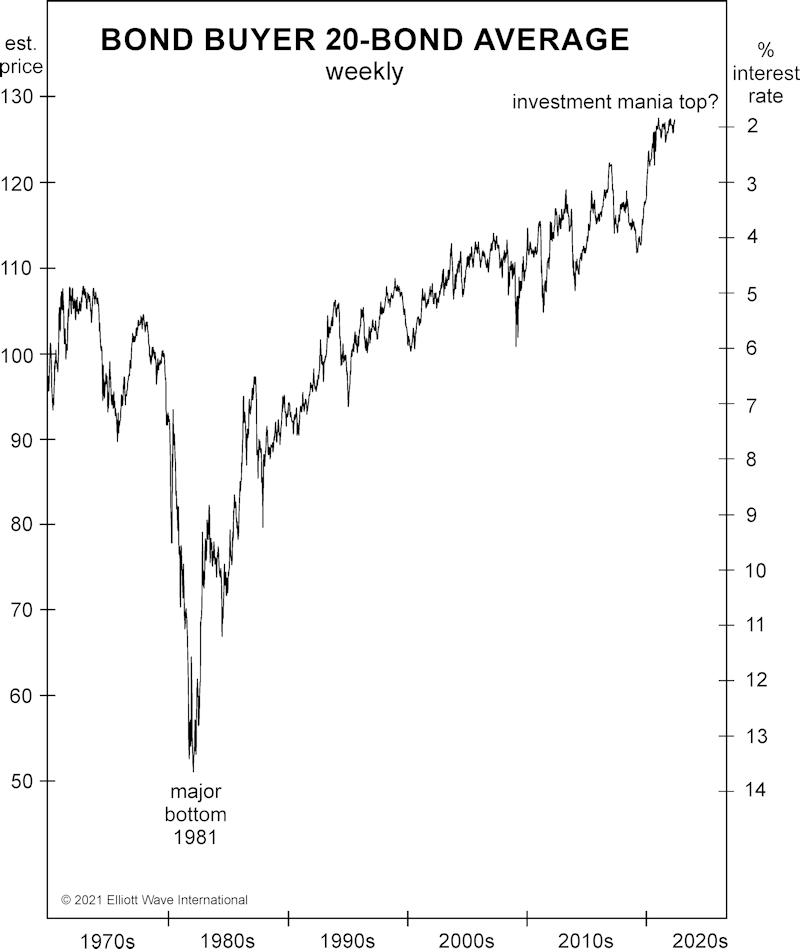
This chart shows a comparable data series (the Bond Buyer 20-Bond average) in recent decades. Notice how similar the pattern is to that of 1915-1929. If bonds follow the path that they did in the 1930s, their prices will fall below the 1981 low, and their interest rates will exceed that year’s peak of 16%.
Conventional analysts who expect bonds to move contracyclically to stocks in the months ahead may be in for a very unpleasant surprise.
Indeed, the financial pages are all abuzz about the prospects of higher interest rates or bond yields.
As this Feb. 10 CNBC news item notes:
The yield on the 10-year Treasury note jumped 8 basis points to hit a session high of 2.01%, the first time that the benchmark rate reached the threshold since August 2019.
Elliott Wave International has been preparing subscribers for higher yields for quite some time.
For instance, back in early March 2020, when the yield on the 10-year Treasury note was at a then record low 0.91%, the March 2020 Elliott Wave Financial Forecast, a monthly publication which provides analysis of major U.S. financial markets, said:
This is the first time that 10-year Treasury note yields have dropped below 1%. … Investor ebullience is the only thing that allows for an embrace of no-yield debt. The tidal wave of risk assumption, however, may be turning.
In other words, prepare for higher yields.
Just a few months later, yields hit a bottom and have been trending upward ever since. Mind you, yields had been in a downtrend for some 40 years! Of course, higher yields mean lower bond prices.
All the while, the stock market has been trending lower as well.
Now is the time to know the Elliott wave chart patterns of both bonds and stocks.
If you’re unfamiliar with Elliott wave chart patterns, you are encouraged to read Frost & Prechter’s Wall Street classic, Elliott Wave Principle: Key to Market Behavior.
Here’s a quote from the book:
The Wave Principle is governed by man’s social nature, and since he has such a nature, its expression generates forms. As the forms are repetitive, they have predictive value.
Get detailed insights into these repetitive forms by reading the entire online version of the book for free!
All that’s required for free access is a Club EWI membership, which is also free. If you’re unfamiliar with Club EWI, it’s the world’s largest Elliott wave educational community and offers members free access to a wealth of Elliott wave resources on investing and trading without any obligations.
Become a Club EWI member now by following this link: Elliott Wave Principle: Key to Market Behavior — free and unlimited access.
This article was syndicated by Elliott Wave International and was originally published under the headline Why the “60 / 40 Balance” May Be Hazardous to Your Portfolio. EWI is the world’s largest market forecasting firm. Its staff of full-time analysts led by Chartered Market Technician Robert Prechter provides 24-hour-a-day market analysis to institutional and private investors around the world.
More Articles:
Speak Your Mind