In a recent live session, Madden revealed his 2026 outlook for the greenback. In 16 minutes, he guides you through the long-term Elliott wave patterns in USD. You’ll see what’s likely next and the key levels you need to know.
Shiller Price Earnings Ratio 2nd Highest in History
November 5, 2025 by Leave a Comment
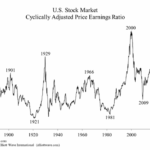
The current reading for the Shiller Cyclically Adjusted Price Earnings Ratio (CAPE) for the U.S. stock market is 39.5. This is the second highest reading in the history of the data going back to 1881, just below the all-time peak of 44.2 at the start of the new millennium. Even in 1929, just before the most famous stock market crash, CAPE only got to 32.5.
This Forecasting Tool Nailed the S&P Turns
July 9, 2025 by Leave a Comment
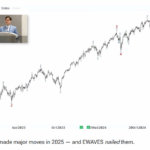
It’s not easy to forecast the twists and turns in the S&P 500 — but this video shows how the EWAVES engine did exactly that.
Warren Buffett isn’t buying — and that says a lot.
June 21, 2025 by Leave a Comment
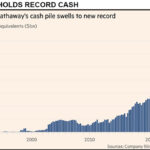
Berkshire Hathaway is sitting on record cash! From @elliottwaveintl: “Buffett could buy up all shares of 476 companies in the S&P 500 at present prices.”
Is Buffett quietly warning that the market is overpriced?
Debt Ceiling Drama
June 13, 2025 by Leave a Comment
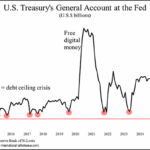
What’s another few trillion dollars? U.S. debt is already approaching a historic $37 trillion and now, Congress is discussing adding at least another $3 trillion to the “debt ceiling.” Yes, that’s the phrase that many hear on the news but know little about. Our June Global Rates & Money Flows sheds some historic light on the topic:Get ready for a summer of apprehension in America as the financial markets fixate on the level of U.S. Federal government debt and whether lawmakers allow the legal limit on it to be (once again) raised. What is the “debt ceiling” and does it really matter?
Tesla’s Troubles — Is it Musk or is it More?
March 14, 2025 by Leave a Comment
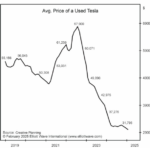
Tesla’s stock price is now less than half its peak only three months ago. Think there may be trouble brewing elsewhere too?
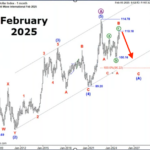
Stock Prices are Out of This World
February 10, 2025 by Leave a Comment
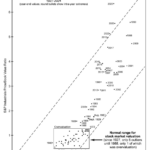
I thought the year-end 2021 overvaluation would never be surpassed. But as you can see, the year-end 2024 reading is both higher and further to the right. It is the highest multiple ever recorded for S&P Industrials’ price to book value and the fifth-lowest level for the S&P Composite’s dividend yield, the four lower readings all occurring in 1998-2001.
Five Benefits of Using the Elliott Wave Principle to Make Decisions
December 9, 2024 by Leave a Comment
While everyone searches for the Holy Grail of forecasting, which does not exist, there is one method of analysis that stands apart from the slew of momentum-based indicators, all of which by definition lag the market. The Elliott Wave Principle is based on the concept that crowd behavior is patterned and that these patterns are easily discerned in the prices of freely traded markets. This alone sets it apart in the world of technical analysis.
Invest Like Warren Buffet
September 19, 2024 by Leave a Comment
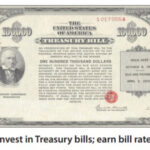
Warren Buffett now owns more T-bills than the Federal Reserve.
It’s true: Buffett’s investment firm, Berkshire Hathaway, owns $235 billion worth of T-bills; the Fed owns $195 billion worth. Of course, most of the Fed’s money is in other government-guaranteed debt. Buffett’s is mostly in stocks. Still, his current cash holdings are about twice the average for the previous five years. How did he accumulate so much cash? By selling stocks in this heady environment.
Gold Prices: The calm before a record run
August 28, 2024 by Leave a Comment
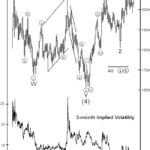
Gold’s three-month implied volatility has declined to its lowest level in over four years. While low volatility is not a short term timing tool, low volatility eventually precedes high volatility. At the same time, total open interest in gold futures has declined to its lowest level since December 2018, as traders are either closing futures contracts or abstaining from opening new ones. The low level of open interest means that investors’ attention is turning away from gold, and the low implied volatility indicates that investors do not expect gold to move much over the course of the next three months. Both are preludes to what we see as a major move forming in gold prices.