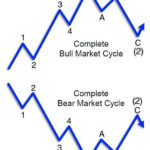
According to Elliott Wave Theory, each cycle is comprised of 8 waves. Each wave is comprised of smaller cycles. Cycles can take days, weeks, months, years, decades, or even centuries to complete. Now is the time to prepare for the completion of the biggest cycle.
Surging Housing Prices Are Entering The Stratosphere- Look Out Below
April 14, 2022 by Leave a Comment
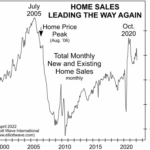
In my Inflation-Adjusted Housing index article, I included a chart that showed recent housing prices skyrocketing not only in nominal terms but in inflation-adjusted terms as well. This means that from a historical perspective houses are more expensive than at any time since 1900! In today’s article, Elliott Wave International editors tell us why we should expect housing prices to decline.
Germany’s DAX: What You Can Learn from the 2007 Top
April 7, 2022 by Leave a Comment
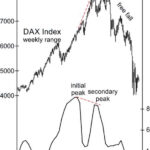
This stock market indicator may be off many investors’ radar but a peak in consumer confidence tends to precede a peak in the stock market. With that in mind, back on Nov. 25, the Telegraph said: Consumer confidence has dropped sharply in Germany. … A few days later, the December Global Market Perspective, a monthly Elliott Wave International publication that offers coverage of 50-plus worldwide financial markets, provided a retrospective of Germany’s DAX and consumer confidence with this chart and commentary:
Historically Investors Become “Long-term Buyers” at Precisely the Wrong Time
February 24, 2022 by Leave a Comment

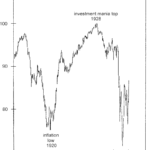
Typically, unsophisticated investors tend to buy near tops and sell near bottoms… exactly the opposite of what they should be doing. And there is a very good psychological reason for this. They start out cautious and then as others begin making more and more money in the market the Fear of Missing Out (FOMO) takes over and eventually they get in to the market. They may make a little money and decide they are geniuses and commit more and more money. Eventually, everyone with available money has invested and there is no one left to buy so the market crashes. The unsophisticated investor holds on initially knowing the market will rebound as it “always” has. Then he holds on because he has “lost too much to get out now” and finally when he can’t stand it any longer he sells vowing never to invest again. This turns out to be the bottom, as there are no more people left to sell, and the market turns up. But “once burned, twice shy” so the unsophisticated investor once again refuses to buy until the market nears another top and “everyone is making money in the market”.
Why the “60 / 40 Balance” May Be Hazardous to Your Portfolio
February 17, 2022 by Leave a Comment
Financial advisors have long advocated a mix of 60% stocks / 40% bonds to cushion portfolios from downturns in the stock market. The thinking is that stocks go up in the long-term, hence, that’s where investors should allocate the most. At the same time, advisors acknowledge that stock prices can sometimes go down so “less risky” bonds will provide at least some protection. The problem with this investment strategy is that bonds can go into bear markets too. Moreover, they can do so at the same time as stocks. Let’s review what happened during the Great Depression of the early 1930s.
Warning: Mergers And Acquisitions Can Vaporize The Stock Market
February 2, 2022 by Leave a Comment
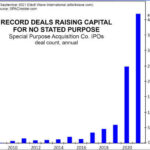
Historically we’ve seen that when market participants become overly optimistic the market has nowhere to go except down. This is logical because at optimism peaks everyone who has any money to invest, has already invested it, so there is no one left to buy. Conversely, when pessimism reaches extremes, no one is left to sell and so the market has to go up, as brave bargain-hunters re-enter the market.
Euro: Look at This Head & Shoulders Chart Formation
December 23, 2021 by Leave a Comment
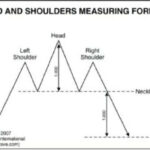
You are probably familiar with the classic “head and shoulders” chart pattern. But, in case you need a refresher, here’s a brief description of a head and shoulders top: The high of an initial upward move is the left shoulder. After a decline, another upward move takes prices to a higher high, or the head. A second decline follows the head. A third rally then takes prices to a peak below the high of the head, and becomes the right shoulder. The left and right shoulders are often similar in duration and extent. A trendline connecting the two lows is called the neckline. When prices penetrate the neckline, a change of trend is believed to have occurred. Head and shoulders bottoms also occur and the same description applies except in reverse. This head and shoulders measuring formula — showing a top as an example — provides even more insight. The commentary is from a past issue of Elliott Wave International’s Trader’s Classroom:
Are Disease Outbreaks Market Indicators?
November 20, 2021 by Leave a Comment
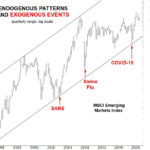
Waves of social mood fluctuate in accordance with the Wave Principle and determine prices in financial markets. Moreover, these same waves regulate the tenor and character of social attitudes and actions. The key point is that social mood is the cause. It is endogenous. Prices in financial markets and events in society are the effects. They are exogenous.
However, most people believe the opposite is true.
Will China’s Crackdown Send Bitcoin’s Price Tumbling?
October 16, 2021 by Leave a Comment
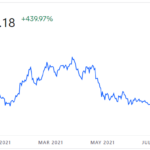
Over the last year, bitcoin has increased by over 400%. As a matter of fact, it has more than doubled since the July low. In today’s article, we are going to look at whether news or even government actions affect the price of bitcoin. In the article, it refers to a proclamation made on July 2, where Elliottwave International says that the downtrend was ending… and then Bitcoin rose throughout July and August, fell through September (bottoming on September 28th), and then it began to rise again. ~Tim McMahon, editor.
Why a Financial “Panic” May Be Just Around the Corner
September 29, 2021 by Leave a Comment
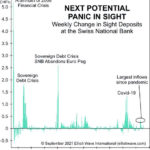
Over the last few months, we’ve been warning that caution is the word of the day. The market was concerned that the FED’s September Statement would include provisions for tightening. That doesn’t seem to be their stance for the near future at least. But that doesn’t mean that the market is going to skyrocket either. As we can see in the following chart of the NYSE, the market definitely leveled off over the summer (despite the FED pumping $120 billion per month into the economy).
There’s one indicator that many investors overlook, and that’s the weekly change in “sight deposits” at the Swiss National Bank. This chart helps show when a financial panic could be building.