We’ve all probably heard that “the odds are stacked against the small trader” when it comes to the stock market. That tends to push us toward investment tools like index funds. But what if the problem isn’t the market but our own brain? In today’s article, the writers at Elliott Wave International examine the psychological profile that turns winners into losers. Plus, 1 FREE course on how to help you stop self-sabotaging “good enough” trades.
Quick Takes on Big Financial Trends
July 27, 2023 by Leave a Comment
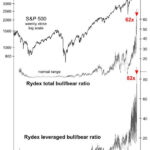
Sentiment indicators… can tell you the extent to which [people] are extremely optimistic or pessimistic. Well, 2021 was a year like no other. Finally, in December 2021, I put out an issue called “A Stock Market Top for the Ages.”
Stocks and Junk Bonds: “This Divergence Appears Meaningful”
June 28, 2023 by Leave a Comment
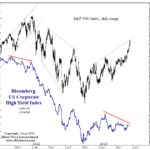
The trends of the junk bond and stock markets tend to be correlated.
The reason why is that junk bonds and stocks are closely affiliated in the pecking order of creditors in case of default. The rank of junk bonds is only slightly higher than equities because debt involves a contract.
Given these two markets are usually correlated, it’s worth paying attention when a divergence takes place. Indeed, a divergence is in the works now. In other words, while stocks have been holding up, the price of junk bonds have been trending lower for much of the year.
Is a Pension Fund Crisis Next?
May 12, 2023 by Leave a Comment

Many public pensions suffer from funding shortfalls. In other words, they don’t have nearly enough money to meet their obligations. More than that, investments are being made in potentially financially dangerous assets to boost returns, such as private equity.
Corporate Bonds: “The Next Shoe to Drop”?
April 26, 2023 by Leave a Comment
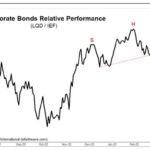
A distinct Head and Shoulders pattern exists where the neckline has been broken over the last few days. The corporate bond market has held in reasonably well over the last year, but we fully expect this sector to be the next shoe to drop.
U.S. Dollar: Has the Mainstream Been Way Too Confident?
December 7, 2022 by Leave a Comment
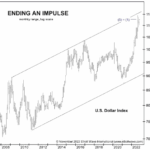
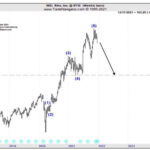
Investors who use Elliott wave analysis know that the main price trend of a financial market subdivides into five waves. Also know that wave 1 and wave 5 are often approximately equal in length. That knowledge helped the Global Market Perspective, a monthly Elliott Wave International publication that covers 50-plus financial markets, make a successful call on the U.S. Dollar index. The November issue showed a monthly chart which dates back more than 14 years
Banks Are Becoming More Cautious About Lending
November 17, 2022 by Leave a Comment
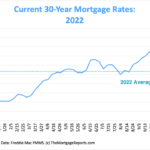
With the FED tightening and raising rates, member banks are feeling the pinch and are being forced to adjust their lending practices. The COVID panic of 2020 and 2021 pushed mortgage rates to record lows below 3%. But with the FED’s money pumping during the same period, inflation soared to over 8%. Initially, the FED felt the inflation surge was “transitory” and was the result of supply shortages due to limited production during the pandemic. So, they refused to change their easy money stance. However, as inflation continued to surge, the FED eventually decided that it had to act.
So the FED began tightening (i.e., reducing FED assets), and raising FED funds rates. As we can see in the chart below, the FED funds rate was virtually zero at the beginning of 2022, and by October, it had shot up to 3.08%.
Will Another “Great Depression” Start in Europe?
September 28, 2022 by Leave a Comment
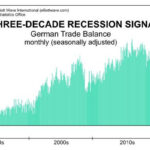
Many people are concerned about the return of a recession now that the FED has been actively tightening and the market has begun falling. Other indicators are flashing signs that we are already in a recession i.e. two consecutive quarters of falling GDP. But so far the National Bureau of Economic Research (NBER) hasn’t officially declared a recession to be in progress. Although, it generally takes them a while after the fact to make the official determination of the beginning (or end) of a recession. In addition to falling GDP other factors can trigger a recession as we will see from the following article from Elliott Wave International. ~ Tim McMahon, editor
Stocks Don’t Go Straight Up (or Straight Down)
September 1, 2022 by Leave a Comment
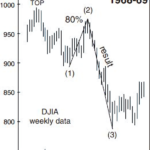
Big stock market trends don’t progress up or down in a straight line. In a bear market, stocks typically rebound after the first leg down. In a bull market, the opposite happens: Stocks again take a big dive, making everyone think the bear market has returned.
But in a bear market, that “first leg down” is wave 1 and the partial “rebound” which follows is wave 2. I say “partial” because the only rule which applies to wave 2 is that it cannot retrace 100% of wave 1. Meaning, the bear market rally cannot go above the previous market top.
How to Prepare for a Hard-Hitting Bear Market (Think 1929-1932)
July 21, 2022 by Leave a Comment
An important step in preparing for a historic bear market is to embrace cash or cash equivalents.
This may seem obvious, but even with the stock market in a downtrend, cash is shunned by many an investor — retail and professional. Many of these investors believe the bull market will resume — sooner rather than later.