The market made a rare move and dipped into an inverted yield curve intra-day but failed to close inverted. An inverted yield curve is when short term treasuries yield more than long term. Typically, this is measured using the 2-year and 10-year Treasuries. On August 14, the two-year U.S. Treasury yield jumped above the 10-year Treasury yield meaning that investing for two years would actually earn you more than locking it away for the riskier 10 year period. Which is illogical and thus rare.
But because this only happened “intra-day” and not longer-term, it created a sharp dip that will not register as “inverted” on the weekly or monthly chart. As Chris Ciovacco explains in today’s video this is actually bullish for stocks. ~Tim McMahon, editor
Bulls Trying to Make a Stand: The Door to a Bullish Bottoming Process Remains Open
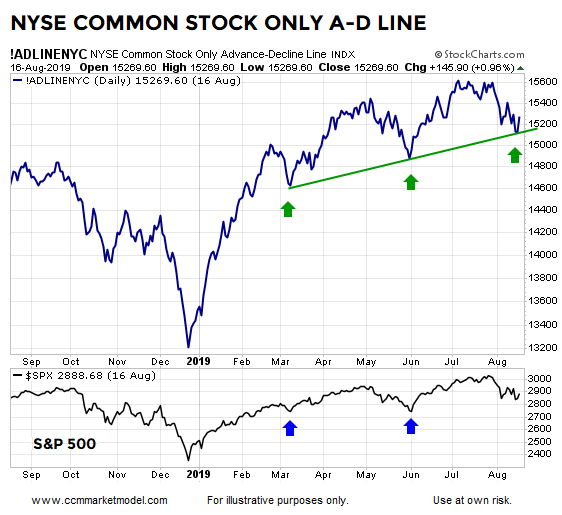
During the trading session on Monday, August 19, the “bottoming process” case for the stock market remained intact. The NYSE Common Stock A-D Line held the line last week at a logical level associated with the S&P 500 reversals in March and June (chart below).
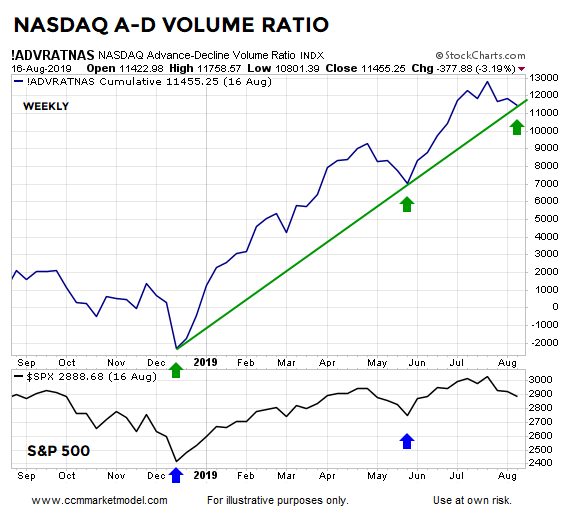
A similar, thus-far-holding-the-line argument can be made using the weekly NASDAQ A-D Volume Ratio. Nothing says breadth will continue to hold these levels, but so far they tell us to remain open to stocks trying to push higher in the coming days/weeks.
The Weight of the Evidence
This week’s stock market video takes a weight-of-the-evidence approach by reviewing both fundamental and technical data, allowing you to draw your own conclusions.
More Downside Would Not Be Shocking
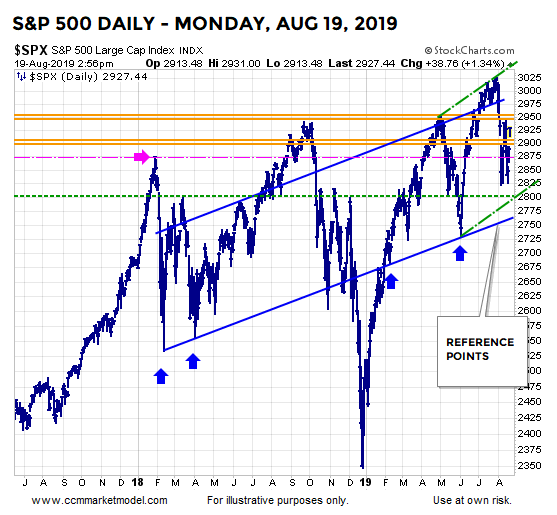
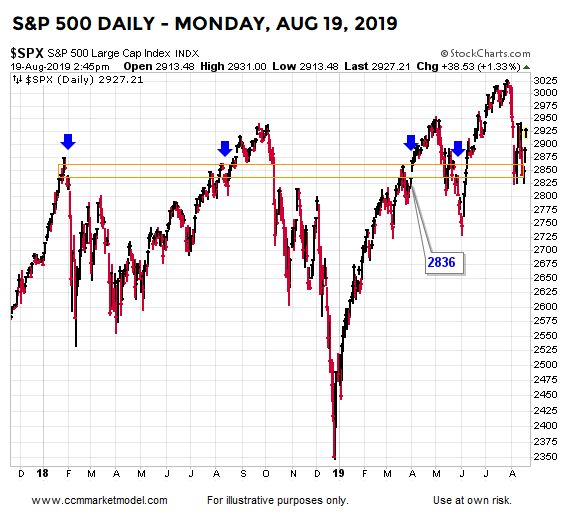
For our approach and our timeframe, the important thing is not what the market does in the next two or three sessions, but rather how things play out over the next two to three years. Thus far, the S&P 500 has made stands near the area of possible support shown after the ugly session that took place on Monday, August 5. An updated version of the chart is shown below.
As noted on numerous occasions over the past two weeks, we have to tactically and mentally account for the possibility of more downside even if good things eventually happen in the coming weeks and months. We have kept some powder dry in the event the market decides to move back toward the 2760-ish to 2790-ish range. The S&P 500 was trading at 2925 during the session on Monday, August 19.
 The Bulls Have Yet to Prove It
Bullish setups have been forming since Monday, August 5. Setups can be followed by positive follow-through or failure. Given concerns about global economic weakness, rare behavior in the bond market, and a speech from a Fed Chairman that has been known to spook markets via off the cuff remarks, it is extremely important that we remain open to all outcomes, from wildly bullish to wildly bearish. We will continue to take it day by day.
This post is written for clients of Ciovacco Capital Management and describes our approach in generic terms. It is provided to assist clients with basic concepts, rather than specific strategies or levels. The same terms of use disclaimers used in our weekly videos apply to all Short Takes posts and tweets on the CCM Twitter Feed, including the text and images above.
This article originally appeared here and has been reprinted by permission.
You might also like:


Speak Your Mind