The Longer A Market Goes Sideways
With busy lives and a constant barrage of new information, many investors have a somewhat limited view of history from a financial markets/economic/political perspective. Albert Einstein reminds us of the benefits of taking a step back to review the bigger picture in a longer-term historical context:
“Somebody who only reads newspapers and at best books of contemporary authors looks to me like an extremely nearsighted person who scorns eyeglasses. He is completely dependent on the prejudices and fashions of his times, since he never gets to see or hear anything else.”
Albert Einstein
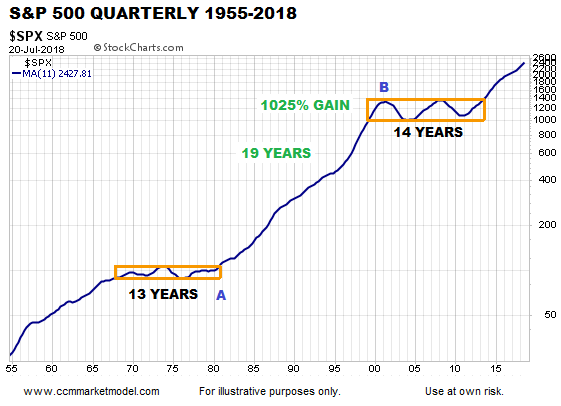
The quarterly chart of the S&P 500 above filters out the day-to-day noise and distraction, allowing us to focus on secular trends. As shown by the simple 11-quarter moving average, the stock market typically oscillates between periods marked by strong trends and periods of consolidation (orange boxes).
After pushing higher in the 1950s and 1960s, the market needed to consolidate its gains. The consolidation period, using the 11-quarter MA as a guide, lasted 13 years. Since long periods of consolidation are typically followed by big moves, it was not particularly surprising that 13 years of frustration were followed by a gain of over 1000% spanning 19 years. The 19-year run was followed by 14 years of frustration, volatility, consolidation, and indecisiveness. The 11-quarter MA broke out of the second orange box in late 2013, telling us to keep an open mind about much better than expected outcomes over the next 10-15 years.
Volatility Will Derail Many
Even if the markets surprise on the upside for the next 10-15 years (TBD), many investors will inevitably fall prey to the market volatility and corrections. This week’s video covers:
- Three habits that can help combat the human tendency to tinker and overtrade.
- A more detailed look at the market’s long-term trend (1955-2018).
- 2018 comparisons to bullish and bearish periods.
- Mental hurdles and biases that often harm investment performance.
Broad Market Broke Out In 2017
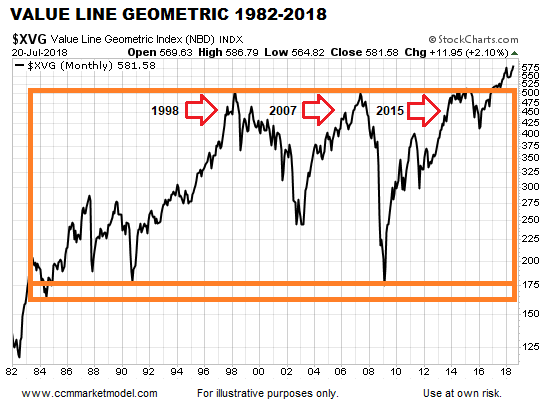
Followers of CCM’s work are familiar with the expression the longer a market goes sideways, the bigger the move we can expect to get. The average stock went absolutely positively nowhere between 1998 and 2017, as shown via the monthly chart of the Value Line Geometric Index below. After acting as resistance in 1998, 2007, and 2015, price finally broke away from the orange box in 2017, telling us to keep an open mind about much better than expected outcomes over the next 10-15 years.
Probabilities Based On Facts In Hand
Charts cannot predict the future; they simply help us assess the probability of good things happening relative to the probability of bad things happening. If the charts shift in a meaningful way, we will reassess the probabilities.
Charts Have Been Helpful For Some Time
The long-term charts have been saying be open to better than expected stock market outcomes for almost two years, including back in August 2016, December 2016, June 2017, and February 2018.
This article by Chris Ciovacco of Ciovacco Capital Management originally appeared here and has been reprinted by permission.
You might also like:
Speak Your Mind