In good times for the market “growth” stocks, the NASDAQ and higher risk assets outperform “safe” stocks like the S&P 500. This is commonly referred to as “Risk-On”. But as the market becomes more cautious and participants are more concerned about the return OF their assets vs. the return ON their assets, they shift away from risky assets and towards Bonds, Utilities, and Gold.
In the series of charts below Chris Ciovacco looks at how defensive assets are faring in the current market compared to how it performed in 2007-2009. ~Tim McMahon, editor
A Chart Is Worth A Thousand Words
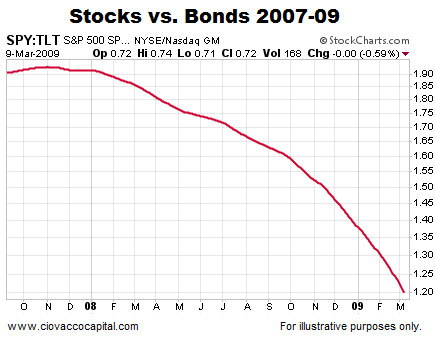
The chart below shows the long-term trend (200-day moving average) in stocks vs. bonds rolling over in a bearish manner as the stock market peaked in late 2007.
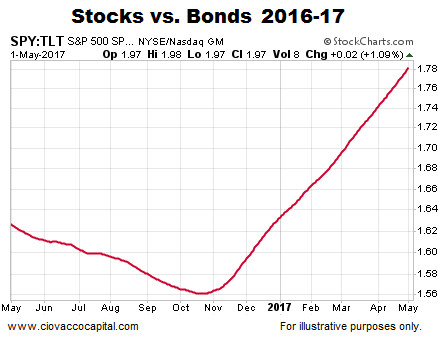
How does the same chart look as of May 1, 2017? The answer is quite a bit better from the stock market’s perspective. The present day long-term trend turned in favor of stocks near the November 2016 U.S. election.
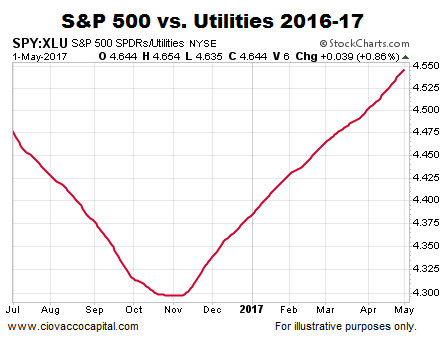
 Income-Oriented Utilities vs. S&P 500
Common economic sense says the conviction to own income-producing utilities would increase as economic fear increases, which is exactly what happened in 2007. In fact, the long-term trend favored defensive utilities well before the S&P 500 peaked in October 2007.

Are similar red flags waving in May 2017? The answer is not yet. The long-term trend turned in favor of stocks back in November 2016 and remains constructive for stocks looking out weeks, months, and years. These charts do not speak to the next few minutes, hours, or days.
This Is Extremely Rare
Last week, the S&P 500’s weekly chart printed something that is extremely rare. The rare occurrence is the main topic of this week’s stock market video.

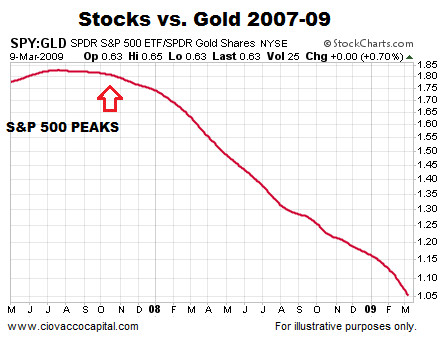
Stocks vs. Safe Haven Gold
When fear picks up, especially long-term fear, the demand for safe haven gold typically increases. The script was followed in 2007 with the long-term trend flipping in favor of gold well before the S&P 500 rolled over.
Is gold waving similar “the long-term trend in stocks needs to be watched very closely” signals in early May 2017? The answer is not yet.

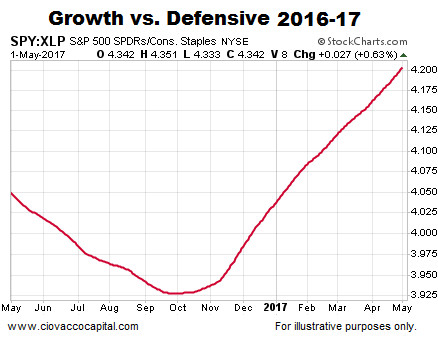
S&P 500 Relative To Defensive Staples
If we examine the S&P 500 relative to defensive-oriented consumer staples, we see a similar bearish turn in 2007. The long-term trend favored consumer staples for the remainder of the financial crisis, a period that included a 50% drop in the S&P 500.
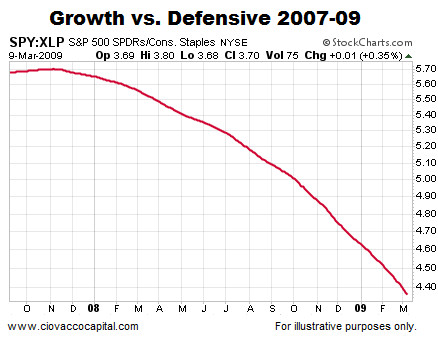
If large money managers were concerned about the long-term outlook for stocks, we would expect to see the conviction to own consumer staples increase relative to the conviction to own the broader S&P 500. It may happen, but it has not happened yet.
Speak Your Mind