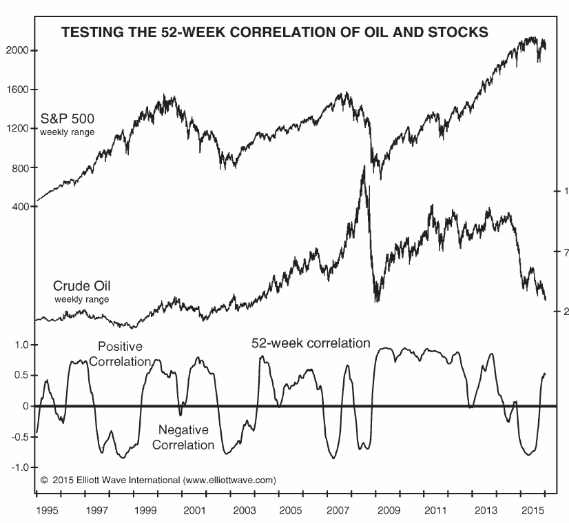
Crude oil took a 30% dive on Sunday, March 8. Yet what’s happened in oil this year is so much bigger than that headline-grabbing, one-day move. In January, oil was $64 a barrel. It hit $27.34 intraday on Monday, March 9, so the price of oil fell 57% in just two months. Talk about a swift decline.
If you turn on your favorite financial news network, the odds are good that you’ll find a pundit speculating about what this move down in oil means for stocks. To help us answer that question, let’s go back to 1973. Economists will tell you that the 1973-74 bear market was due to the infamous OPEC oil embargo. The embargo is a real thing that happened from October 1973 to March 1974, and it’s true that oil prices quadrupled over that time. But the stock market topped in January 1973. Stock prices had been falling for nine months before the embargo began, so the embargo cannot have caused the bear market in stocks. Plus, stocks continued to fall for nine months after the embargo was lifted, further destroying the embargo-caused-the-crash argument.
Although the data don’t support economists’ argument, let’s consider the logic that underlies their argument for a moment. The embargo resulted in oil shortages and pinched household and corporate budgets, ostensibly exacerbating the bear market and pushing the economy into a recession. But if drastically rising oil prices are bad for stocks and the economy, then logic demands falling oil prices must be good for stocks and the economy. Yet oil collapsed 78% in 2008 during the worst of the bear market in stocks. And the recent price slide in oil has overlapped a global selloff in stocks.
So what’s going on? The truth is that the correlation between stocks and oil swings willy nilly from positive to negative throughout history, as you can see on the chart. Pundits will try to use one market to predict the other, but the reality is that there’s no reliable relationship between the two at all. To understand each market, you have to look at each market’s Elliott waves.
By Elliott Wave International
Discover how Elliott waves can help you catch moves in the oil market when you watch a special video from EWI’s chief energy analyst, Steve Craig, available to ClubEWI members.
Sign up for FREE and watch instantly.
You might also like:
- History Says Stocks Can Perform Well After Big Oil Shocks
- Are Falling Oil Prices Really Good for the Stock Market?
- Technicals vs. Fundamentals: Which are Best When Trading Crude Oil and Natural Gas?
- What Does this Rare & Rapid Drop in Manufacturing Mean?

Speak Your Mind