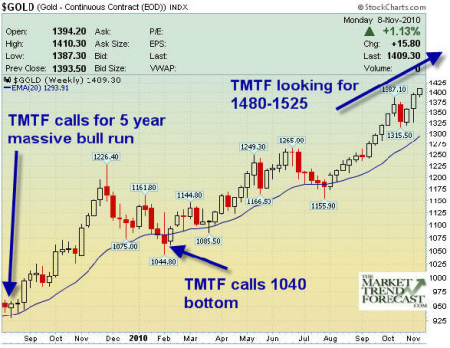
In today’s editorial, David Banister takes a look at Gold and where it could be going. He provides an excellent possible scenario that matches with my views and experience exactly. He is projecting a rally to the $1500 range with a pull back from there and a major take-off for the final wave to the blow-off top from there. This is exactly what we would expect based on Elliottwave patterns. Tim McMahon- editor
Gold How to Play it Now
David Banister-www.MarketTrendForecast.com
Regular readers of my articles on Gold over the past few years know that I have a theory on this Gold Bull market. In summary, it’s that we are in a 13 Fibonacci year uptrend that started in 2001, and now we are in the final 4 years of that uptrend. It is in this last 5 year window that I theorized started in August of 2009 that investors really get involved. As the crowd comes in, prices push higher and higher, and then more and more investors come in and so forth.
The very recent rally has pushed us up to about $1,420 per ounce, on the way to my projected $1480-$1520 pivot highs on this leg from the $1040 area in February of this year. Subscribers to my TMTF newsletter have learned about Elliott Wave Theory and how to properly apply it to benefit from both the ups and the downs in various parts of the markets, as well as commodities and precious metals. If I am correct, we are in the 3rd wave up of 5 total waves from the August 2009 $900 per ounce levels. The first leg went from $900 to $1225, the second leg was corrective to $1,040, and now this 3rd wave should complete at around 150% of the 1st wave’s amplitude. In English, the probabilities are for Gold to continue higher to about $1527 per ounce, possibly a tad higher if the typical Elliott Wave patterns take hold, and also assuming again that I am correct in my read of those patterns.
 One of the better ways to play this next 4 years of upside with intervening corrections is to look at prospect generator companies. These are Gold, Silver, and Copper explorers that do the early field work in identifying prospects for drilling. They then farm out these projects to willing partners and retain equity stakes and /or percentiles of the project itself. This reduces their need for capital while retaining nice upside for shareholders, and diversifying. When you are a tad long in this current wave pattern’s tooth, this is way to stay onboard, but not go overboard. I have personal ownership positions in a few of these types of companies, and my subscribers are aware of the few that we really prefer. Should one of the projects not pan out, you are not placing your entire shareholder bet on one drill project, and yet if they hit on a few, the upside can be substantial.
In the meantime, below is a chart pattern of where I see this rally peaking out and where I forecasted recent pivots. As we approach these levels, ($1480-$1525), it may be a good idea to pull back on some of your positions whether it be the metal itself or individual stocks.
If you would like to follow David’s free weekly updates or consider subscribing, sign up at www.MarketTrendForecast.com and Receive a Special Coupon Offer Today!

Hi Dave,
What happened Friday ? It looks like a trend change to me .
Paul