The stock market, and the lingo associated with it, might as well be a foreign language to most Americans. Most people are not even sure how the stock market works or what it means, let alone what a “moving average” is. Simply, put a moving average is exactly what it implies: the average rate at which a stock has moved over a specific period of time. But the “moving” part of the name involves the fact that the time period being measured is constantly moving.
Obviously, stocks move in one of two directions- either up or down. When a stock goes up, the price and value associated with the company rises, and when a stock goes down, the price and value associated with company goes down. So, to explain it in the simplest terms, the moving average refers to the use of averages over a span of time to determine whether a stock will continue its path- to rise or to fall.
According to Wikipedia “In statistics, a moving average, [is] also called rolling average, rolling mean or running average… In financial applications a simple moving average (SMA) is the unweighted mean of the previous n datum points.
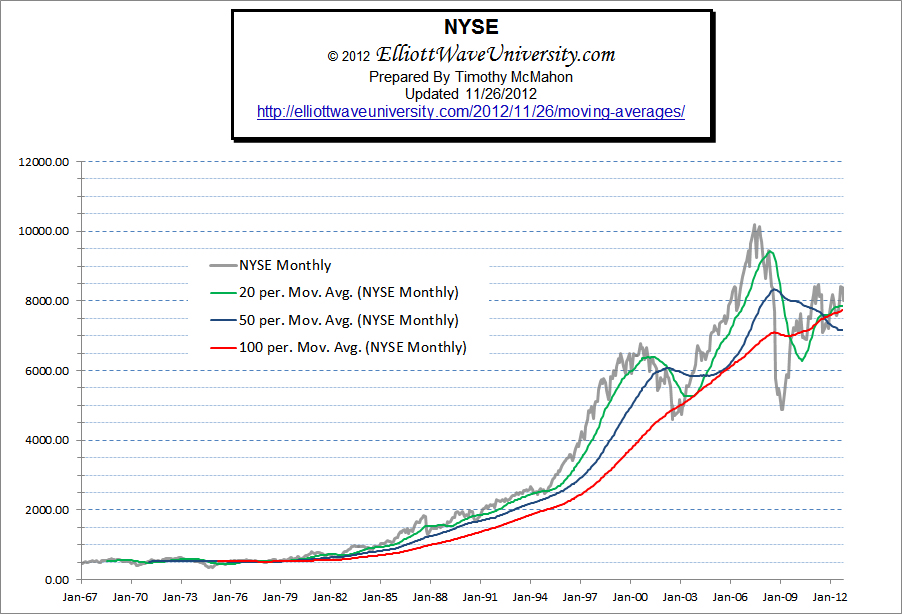
A simple moving average is calculated by taking the closing price of the past “n” number of periods and adding them all up and then dividing by the number of periods. The next day you drop off the first data point and add the current one into the average (thus the moving part). In the following chart of the New York Stock Exchange there are three moving averages 20 periods, 50 periods and 100 periods. Since it is a monthly chart each period is one month. So the 20 period moving average takes the average of the previous 20 months and puts a single point on the chart. Thus if you look closely you will see that it doesn’t start until the 20th month on the chart.
Click Chart for larger Image
Typical Moving Averages
Different investors choose different lengths of time to average over. Longer term investors choose longer term averages and shorter term investors choose shorter periods. Longer term investors may look at the moving average based on days or even weeks or months while day traders or scalpers may look at the moving average of hours or minutes. The same trader may even prefer different time periods depending on the underlying stock (or commodity) that he is looking at.
Suppose he chooses the 15-period moving average, which documents the average movement of the stock over a period of 15-days, hours or minutes. This will tell him the short term trend. He may also choose a 50-period moving average, which documents the movement of a stock (up or down) over a longer period. Both types of moving averages are used on a regular basis by professional traders in order to gauge the current condition of the market.
The moving average is really just a barometer, a simple meter which can tell you worlds about how a stock is performing. The moving average is a tool used to identify trends, which is the name of the game in stock market circles. The popular saying among stock traders, is “the trend is your friend,” when the stock price moves up through the moving average the trend is up and when the stock price is below the moving average the trend is down.
Moving Average Length
Depending on the length of the moving average, a stock trader can gather a lot of information from it. Short-term averages respond more quickly to changes in the direction of the stock, than long-term averages do. Using moving averages that are less than 20 periods, a stock trader can determine the short-term direction of a stock.
Remember just because a stock has been going in one direction for a long time doesn’t mean that it will continue in that direction. Let’s assume that a stock is going up over the long term. The price will be above its moving average and as it accelerates toward its peak, it will get further from its moving average. As it slows down and starts to change direction the moving average will get closer to the underlying stock and close the gap. Eventually, the stock will cross below its short-term moving average first. If it continues down it will cross its medium term moving average and finally its long term average.
Advantages of Different Moving Average Periods
A fast moving average (few periods) is beneficial in that it generates an early signal allowing you to get out quickly before you lose too much money. The down side is that you may get “whipsawed” getting out just in time for the index to cross back above the fast moving average forcing you to get back in again. A longer term average will avoid that but at the cost of losing more money before you get out. (see the difference in performance between the 20 period and the 50 period moving average in the chart above).
Using Multiple Moving Averages
Many times, a stock trader will compare all three of the moving averages (0 to 20 days, 20 to 80 days and 80 or more days) against each other. When all three types of moving averages are compared to each other you can look for a crossover, in which a short term moving average will cross over the medium term average and finally the long term average. This can be a more accurate (although slower) indicator of a change in direction than simply having the price cross a moving average.
In the above chart, we have the monthly price of the New York Stock Exchange (NYSE) in Grey. The 20 period moving average is in Green (in this case that means it is a 20 month moving average). The 50 month moving average is in Blue and the 100 Month Moving Average is in Red. In the crash of 2008 we can see that had we simply exited our positions when the price (grey) crossed below the 20 month moving average (green) we would have missed most of the carnage. The price then crossed below the 50 month moving average and finally below the 100 month moving average. then the 20 month crossed below the 50 month and finally below the 100 month moving average. By that point the price had already turned back up and almost intersected the point where the 20 was crossing below the 100. As the price crosses above the 20 a buy signal is generated.
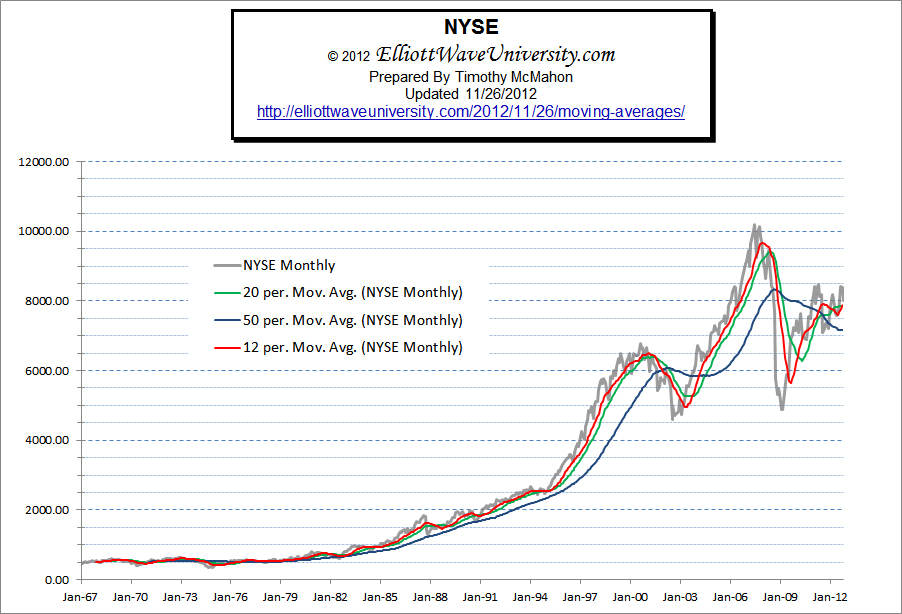
In the chart below the 100 period moving average was determined to be too slow to be of much use so it was changed into a 12 period moving average. Now you get some touches but no real crosses. Therefore the cross below the 12 month moving average in 2008 is a good warning and when it crosses below the 20 it is a definite sell signal. Next the 12 month moving average crosses below the 20 and finally below the 50. The buy signal is the reverse, as the NYSE crosses back above the 12 month moving average and then the 20 and the 12 month moving average moves above the 20 and finally crosses above the 50.
Click Chart for larger Image
Note: We are looking at a monthly chart so that means that 12 periods gives us an average for an entire year. Thus even though the number is fairly small it is actually a rather long term average. If we were using a weekly chart there would be a lot more data points. So in order to get the red line to track in the same place we would have to use a 52 week moving average. If we were looking at the daily chart we wouldn’t use 365 because we are only interested in the “trading days” so we would use 252 because the market is closed 104 days for weekends and 9 holidays. So a 12 month moving average equals a 52 week moving average equals a 252 day moving average.
See Also:
Moving Averages and the Elliott Wave Principle
The Popgun: A Two-Bar Pattern that Points to Trade Setups
Market Patterns Repeat Themselves
Byline
This article was composed by Otter Boone for the team at Valpak.com; check out their awesome deals and coupons.

