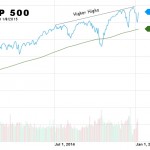
Today we are going to take a look at two common stock market charts that individually tell opposite stories but when combined give us an interesting insight into the overall market. The first chart is the S&P 500. As I’m sure you are aware the S&P 500 represents Standard and Poor’s top 500 companies.
When You Trade and Invest, Why Use the Wave Principle?
The question: Why use the Wave Principle when trading or investing? The answer: To avoid the herd that usually loses money in the markets. The explanation: Herding makes it difficult to follow the most useful trading advice to buy low and sell high. More often than not, what really happens is that you hear about […]
