
Who could have thought that something called a “digital currency” that first appeared in 2009 and was widely available for 1 cent (and no one cared!) eight years later would be going for $20,000 a pop? It’s the wildest financial craze of our time. Wait, scratch that — it’s the wildest financial craze ever, because Bitcoin is up not 100%, not 1,000%, not even 10,000%. Since inception, Bitcoin is up 32,000,000%. Yes, thirty-two MILLION percent.
U.S. Stocks: A Sentiment Extreme You MUST Pay Attention to
November 2, 2017 by Leave a Comment

Robert Kelley, the editor of Elliott Wave International’s US Stocks Intraday Pro Service, tells you about a sentiment extreme that he’s seen recently. Watch this new interview to find out what has caught his attention and what they mean for U.S. stocks going forward.
Did You See the 30% Rise in This Major Global Stock Index?
October 5, 2017 by Leave a Comment
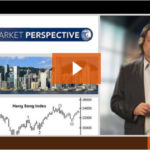
In this video Robert Folsom shows the indicators leading the Hong Kong Hang Seng Index to gain 30% in 9 months.
Silver Chart of the Day
September 26, 2017 by Leave a Comment
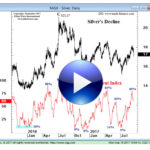
Silver has had several major peaks over the last year. But interestingly sentiment has been an excellent indicator of peaks. In this video we will look at the correlation between Silver’s price and market sentiment.
What Does “Paddle-boarding” Have to do with Speculating?
August 26, 2017 by Leave a Comment
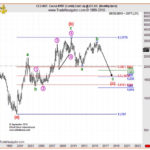
Sometimes when your mind is in the “Zone” unusual correlations will just pop into your head. According to Wikipedia, “The eureka effect (also known as the aha! moment or eureka moment) refers to the common human experience of suddenly understanding a previously incomprehensible problem or concept.” An editor of Elliott Wave International had a eureka aha moment while paddle-boarding and in this article, he looks at Elliott Wave Setups, Cocoa and surprisingly how that correlates to of all things Paddle Boarding. ~ Tim McMahon, editor.
Understanding the Relative Strength Index (RSI)
August 15, 2017 by Leave a Comment
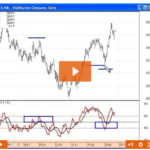
Two of the most commonly used technical indicators of momentum in trading are the moving average convergence divergence, or MACD, and the Relative Strength Index (RSI). Today Jeffrey Kennedy is going to be looking at RSI. It was developed by legendary trader J. Welles Wilder. It is a “momentum oscillator”. As the price of a security rises, price momentum increases. The faster the security rises (the greater the period-over-period price change), the larger the increase in momentum. Once this rise begins to slow, momentum will also slow. Our NYSE ROC chart is a type of Momentum chart.
Top 3 Technical Tools Part 1: Japanese Candlesticks
August 9, 2017 by Leave a Comment
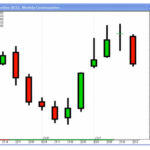
Jeffrey Kennedy to name 3 of his favorite technical tools (besides the Wave Principle). He told me that Japanese candlesticks, RSI, and MACD Indicators are great methods to support Elliott wave trade setups.
When Prices Are Falling, TWO Numbers Matter Most
July 22, 2017 by Leave a Comment
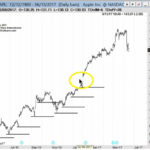
On June 29, the Apple iPhone turned 10 years old. But, for many, the mood surrounding the milestone was less than celebratory. Reason being, in June alone, Apple Inc. (AAPL) plunged 6% to two-month lows amidst a broad-scale bruising of the global tech sector.
Crude Oil Sinks 20% Despite OPEC Production Cuts
June 30, 2017 by Leave a Comment
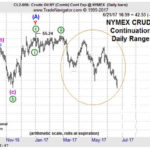
On January 1, the long-awaited agreement between OPEC and its major exporting partners like Russia to curtail production by 1.8 million barrels a day went into effect. And, according to the mainstream experts, the massive effort to cut the oil glut would also light the fire beneath oil prices. But that’s not what happened…
Robert Prechter Talks About Elliott Waves and His New Book
April 21, 2017 by Leave a Comment

It’s been a long time since we’ve offered you an article featuring Robert Prechter directly. We’re especially excited to offer you this thoughtful interview Avi Gilburt conducted with Bob.