Learn about the “Head and Shoulders” Measuring Formula
By Elliott Wave International
You are probably familiar with the classic “head and shoulders” chart pattern.
But, in case you need a refresher, here’s a brief description of a head and shoulders top:
The high of an initial upward move is the left shoulder. After a decline, another upward move takes prices to a higher high, or the head. A second decline follows the head. A third rally then takes prices to a peak below the high of the head, and becomes the right shoulder. The left and right shoulders are often similar in duration and extent. A trendline connecting the two lows is called the neckline. When prices penetrate the neckline, a change of trend is believed to have occurred.
Head and shoulders bottoms also occur and the same description applies except in reverse.
This head and shoulders measuring formula — showing a top as an example — provides even more insight. The commentary is from a past issue of Elliott Wave International’s Trader’s Classroom:
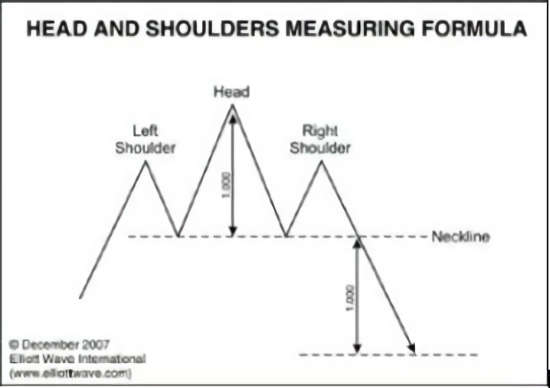
To identify a high-probability price target for the move following the break of the Neckline, measure the distance between the Head and the Neckline and then project that distance down from the point at which the Right Shoulder breaks the Neckline.
The July 2021 Global Market Perspective, a monthly publication which provides coverage of major global financial markets, applied this knowledge to a forecast for the euro.
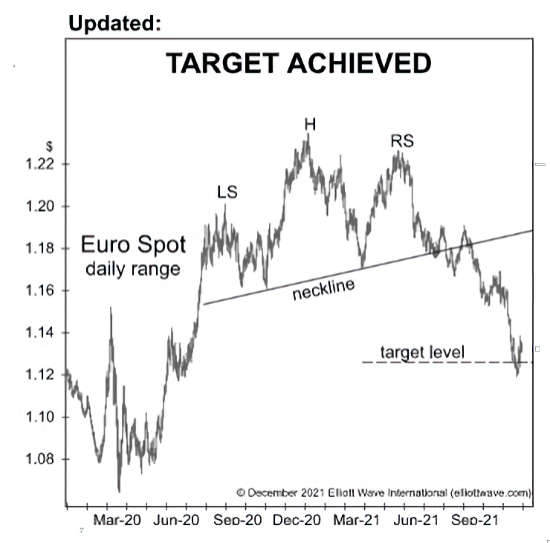
The chart on the left is from that July issue of the Global Market Perspective and the chart on the right was updated for the December Global Market Perspective. Here’s what the December Global Market Perspective said:
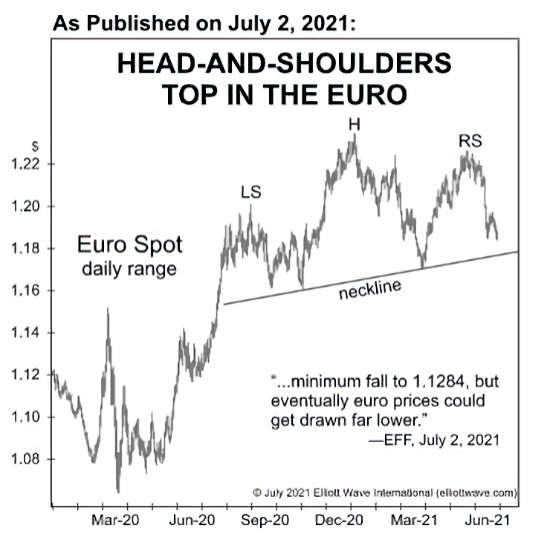
A relentless four-month decline pulled the euro slightly below our downside target of $1.1263 on November 19, as these before-and-after charts show. On November 24, the euro bounced from its $1.1185 low.
You can learn about other classic chart patterns by reading Frost & Prechter’s Elliott Wave Principle: Key to Market Behavior. Here’s a quote from the book:
The Elliott Wave Principle not only supports the validity of chart analysis, but it can help the technician decide which formations are most likely of real significance.
Get the details of how the Wave Principle “supports the validity of chart analysis” by reading the entire Wall Street classic for free!
That’s right — you can get unlimited and free access to the online version of Elliott Wave Principle: Key to Market Behavior by simply joining Club EWI — the world’s largest Elliott wave educational community.
Don’t worry — Club EWI members are not under any obligations — yet, members do enjoy free access to a wealth of Elliott wave resources on investing and trading.
Current resources available to Club EWI members include the report, “Crypto Trading Guide: 5 Simple Strategies” and the new video offering “Apply This Technique to Stop Rushing into Trades.”
Plus, as mentioned, free access to Elliott Wave Principle: Key to Market Behavior (just click on the highlighted link to have this Wall Street classic on your computer screen in moments).
This article was syndicated by Elliott Wave International and was originally published under the headline Euro: Look at This Head & Shoulders Chart Formation. EWI is the world’s largest market forecasting firm. Its staff of full-time analysts led by Chartered Market Technician Robert Prechter provides 24-hour-a-day market analysis to institutional and private investors around the world.
You might also like:
Speak Your Mind