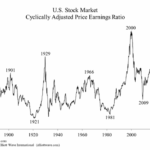
The current reading for the Shiller Cyclically Adjusted Price Earnings Ratio (CAPE) for the U.S. stock market is 39.5. This is the second highest reading in the history of the data going back to 1881, just below the all-time peak of 44.2 at the start of the new millennium. Even in 1929, just before the most famous stock market crash, CAPE only got to 32.5.
Stocks Can’t Keep Going Up Forever… Or Can They?
January 22, 2018 by Leave a Comment
Wall Street traders love to live by “truisms”, “clichés”, and/or “maxims”. One such refrain that we constantly hear is that “Stocks can’t keep going up forever” but then there is “the trend is your friend” and “the market climbs a wall of worry”. When you put them all together what do you get? Should you worry about a top or should you be happy that others are still worried… because that means the top isn’t here yet? After-all, the market continues to climb until everyone has bought. If there are still bears out there, they are still potential buyers. On our NYSE Rate of Change page we published a couple of charts by “Chart of the Day” which showed the average length of rallies before a 15% and 20% decline. But if you take a longer term view, even a 15-20% correction could be inside a longer term bull market.
In today’s post, Chris Ciovacco of Ciovacco Capital Management takes a look at the historical precedent for the current market.