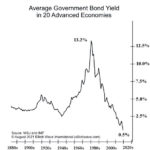
Ever since my Boy Scout days their “motto” of “Be Prepared” has been my guiding philosophy. Buying when things are plentiful is much better than fighting the crowds when things are scarce. (Think toilet paper in 2020). Unfortunately, “hoarding” has gotten a bad name because some individuals try to buy up all the scarce supplies WHEN THEY ARE SCARCE but if you buy when they are plentiful, it isn’t hoarding… it is being prepared. And rather than being a bad thing… it is actually a good thing. Here’s why: If you have your own supply you won’t be competing with the unprepared for the scarce resources. You may even have enough to share some with your friends and neighbors. In today’s article by Elliottwave International, we’re going to look at scarcity and its companion austerity and how they relate to the cost of money. ~ Tim McMahon, editor
The Maniacal Residential Real Estate Market

If you’ve heard anything about Real Estate in the last year you’ve heard about how crazy the market is getting. People are buying houses sight-unseen for more than the asking price. It’s just crazy. Anyone who has ever experienced any sort of bubble mentality knows that this is exactly what a bubble feels like. The problem with bubbles of course is that they always last longer and go higher than a rational person would think possible. And I guess that is sort of the point… a bubble occurs when prices are no longer rational. The tricky part is knowing when the bubble is going to pop. This reminds me of the old saying that says “it is better to get out a month too early than a day too late.” The following video talks about the condition of the current Real Estate market and indicators of a top.
Why U.S. Corporate Bankruptcies Could Skyrocket
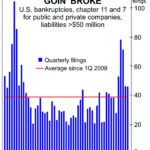
Typically, as you would expect, corporate bankruptcies occur most frequently when the economy is bad. Marginal companies that were just hanging on in “good times” are the first to fail as money gets tighter. The last spike in corporate bankruptcies was in the aftermath of the 2008 crisis. But in 2020, we saw another spike in bankruptcies from a different cause, i.e. COVID shutdowns. Despite government subsidies, bankruptcies soared, the economy tanked, and millions of people sat home and collected enhanced benefits. So now that we are halfway through 2021, how are we faring?
Why “Trouble is Brewing” for the U.S. Housing Market
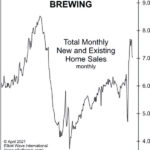
We keep hearing about the “Housing Madness” that shows “No Signs of Slowing.” A would-be renter offered $2 million for a summer rental in the Hamptons and was turned down! Still, there are subtle but important signs of trouble in paradise. As the chart shows, total new and existing home sales made a countertrend rally high in October, which was still 21% below the all-time high in July 2005. As we have noted, home price declines follow home sales declines.
Interest Rates Win Again as Fed Follows Market
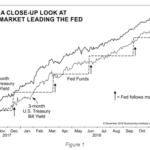
Most economists and financial analysts believe that central banks set interest rates. For more than two decades, Elliott Wave International has tracked the relationship between interest rates set by the marketplace and interest rates set by the U.S. Federal Reserve and found that it’s actually the other way around–the market leads, and the Fed follows.
Watch This Indicator for Approaching Volatility
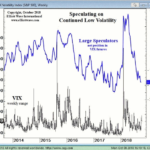
The stock market’s volatility from late July through early October was extraordinarily low. For 50 straight days the S&P 500 had not closed more than 0.8% in either direction, the longest such streak since 1968.
Yet, on October 3, all that changed. The markets dropped hard… and the VIX suddenly spiked even harder.
Have Smartphone Sales Peaked?
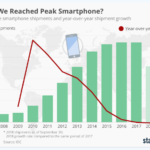
In the following article charts from Statista.com looks at the Cell Phone sales situation as of the end of the 3rd quarter of 2018. At this point it looks like sales have leveled off but it is quite possible that people are simply waiting for the advent of the new 5G phone capability.
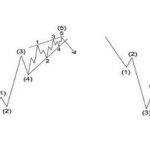
A Method Traders Can Use to Confirm an Elliott Wave Count
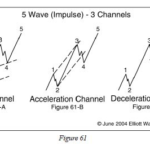
By Elliott Wave International When you are watching a pattern develop on a chart, how can you be sure that your Elliott wave count is correct? Elliott Wave International’s Senior Analyst Jeffrey Kennedy spent years designing his own technique to improve his accuracy. He came up with the Kennedy Channeling Technique, which he uses to […]
Credit Suisse & UBS have a Message for Wealthy Clients

Political uncertainty and geopolitical risks have kept wealthy investors out of the stock market’s rally of new highs. “Now’s the time for them to jump back in and take advantage of the gains still to be made”, say the people looking after their cash.
Elliott Wave Analysis: Where the RUBBER Meets the Road
There are nearly 50 commodity markets traded all over the world at any given time. That’s one for every state in the United States. So, how is an investor or trader supposed to know which of these markets to follow and which ones to dismiss?