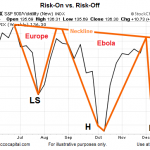
The chart above has some common characteristics found in a potentially bullish formation known as an inverse head-and-shoulders pattern. A break of the orange neckline will improve the odds of the current rally in equities carrying quite a bit further.
How Should Investors Handle Iraq?
Less than three years after the abrupt U.S. pull-out of Iraq the country is falling apart as Islamic militants who seized cities and towns vowed to march on Baghdad and settle old scores. In northern Iraq, Kurdish security forces moved to fill the power vacuum — taking over an air base and other posts abandoned […]
It’s Difficult to Buy the Rumor
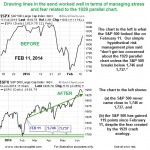
Rumor has it that the European Central Bank (ECB) fears low inflation or even deflation so what should we do with our investments? Should we, as the old saying goes, “buy the rumor, sell the news?” In today’s article Chris Ciovacco, looks at what is expected from Thursday’s ECB statement and what to do about […]
Educate Yourself about FOREX
With the increasing popularity of online Forex trading you may have considered investing in this field. But before you start, you need to understand all the risks in order to get the expected results. There is no doubt that practical experience is much more valuable than just theoretical knowledge that you acquire by reading, researching and discussing with […]
Write-Downs: Death Sentence or Opportunity?
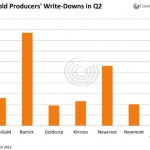
By Jeff Clark, Senior Precious Metals Analyst For many primary gold producers, Q2-2013 was a breathtakingly bad quarter. It wasn’t so much the massive drop in earnings many reported—those had been, for the most part, expected—but the so-called “impairment charges” announced. (Impairment is the opposite of appreciation, that is, the reduction in quality, strength, amount, […]
The Non-linearity of Market Trends, and Space Programs
Linear projections will often take you down the wrong path By Elliott Wave International Let’s begin with the old paradox: “The only constant is change.” This is the main reason why projecting present conditions into the financial future so often fails. If someone had asked you in 1972 to project the future of China, would […]
Thoughts from the Frontline: Can It Get Any Better Than This?
What in the world is going on?! As I write this letter from the Maine woods, the S&P 500 has just cleared 1,700 for the first time. The German DAX continues to set all-time highs above 8,400. The United Kingdom’s FTSE 100 is quickly approaching its 1999 record high of 6,930, and its mid-cap cousin, […]
What is the Yield Curve and What Others Are Saying About It
What is the Yield Curve? The yield curve is a graphical representation of several “yields” or interest rates over varying contract lengths i.e. 1 month, 2 months, 3 months, 1 year, 2 years, 10 years, etc… The curve shows the relationship between the interest rate or cost of borrowing and the time to maturity. For example, interest rates paid on […]
3 Common Trading Pitfalls — Plus 6 Free Lessons
If your technical approach needs improvement, you are not alone. Our FREE report can help! By Elliott Wave International Long-term trading success depends on more than the right trading method: adequate capitalization, money management skills and emotional discipline are also vital. Yet it isn’t always easy to put your finger on which elements of trading […]
S&P Final Wave Up?
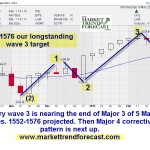
In the Elliott Wave model, market prices alternate between the primary trend (or impulsive) and the corrective phase. Impulse waves are always subdivided into a set of 5 lower-degree waves. Corrective waves subdivide into 3 smaller-degree waves. In a bull market the dominant direction is upward so the five waves would be upward. In a bear market […]
