No Fear Mongering, Just Facts Group of 20 finance chiefs and central bankers said current risks include uneven growth and the possibility of excessive risk-taking in a low interest rate environment. They also pointed out that when push comes to shove, they will continue to stimulate. From Bloomberg: “It is critical that we take concrete […]
How to Find Trading Opportunities in ANY Market: Fibonacci Analysis
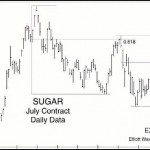
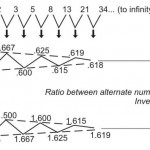
The primary Fibonacci ratios that I use in identifying wave retracements are .236, .382, .500, .618 and .786. Some of you might say that .500 and .786 are not Fibonacci ratios; well, it’s all in the math. If you divide the second month of Leonardo’s rabbit example by the third month, the answer is .500, 1 divided by 2; .786 is simply the square root of .618.
Elliott Wave Projecting Gold Bottom?
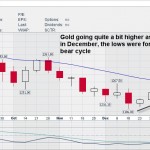
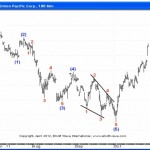
By David A Banister We have been writing about the bottoming process of the Gold Bear Cycle (Elliott Wave Theory) since December 4th 2013, and our most recent article on December 26th reiterated that the best time to accumulate the Gold/Silver stocks was in the December and January window. Specifically this is what we wrote: […]
Flexibility Important During Indecisive Periods
The Fundamentals are Reflected in the Charts The market’s pricing mechanism, is based on the aggregate opinion of every investor around the globe and thus allows us to compare economic confidence in late 2007 to the present day. A more direct way to say it is “charts enable us to monitor the conviction that stocks […]
15 Hand-Picked Charts to Help You See What’s Coming in the Markets
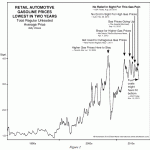
Everyone uses gas: See this chart that shows why its price is heading lower By Elliott Wave International Have you ever seen price charts that tell a story clearly? Here is a perfect example from Robert Prechter’s most recent monthly publication, The Elliott Wave Theorist. By combining headlines from newspapers with the price chart for […]
Spot High-Confidence Trading Opportunities Using Moving Averages
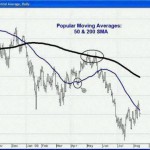
High confidence trading opportunities are those trade set-ups that have a high probability of resulting in a profitable trade. Of course, not every trade will be profitable but finding those with the best chance for success will put the odds in your favor. In previous issues we have looked at a variety of ways […]
Have All the “Buyers” Already Bought?
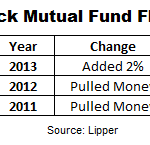
In a Bull market that is appreciating sharply, greed begins to take over and people begin speculating with money they can’t afford to lose. Logic would dictate that when it gets extremely bullish everyone who is going to buy has already bought and so with no one left to buy the market falls. And when the market falls […]
How to Find Trading Opportunities in ANY Market Using Candlesticks (Video)
Candle stick patterns are believed to be first developed by Japanese rice merchants hundreds of years ago but it wasn’t until recently that they began to catch on here in the United States. But they seem to be replacing the traditional Open, High, Low, Close (OHLC) stick figure format, perhaps because they provide a bit […]
How to Identify Turning Points in Your Charts Using Fibonacci
Leonardo Fibonacci (aka. Leonardo of Pisa) was the son of a merchant and well educated in the use of numbers while keeping his father’s books but in those days all of Europe used “Roman Numerals” and calculations were difficult. Leonardo was instrumental in bringing the Arabic numeral that we use today to Europe. But although […]
