Patterns are everywhere. We see them in the ebb and flow of the tide, the petals of a flower, or the shape of a seashell. If we look closely, we can see patterns in almost everything around us. The price movements of financial markets are also patterned, and Elliott wave analysis gives you the tools […]
Applying Fibonacci to Stock Market Patterns: It’s easier than you might think!
February 3, 2012 by Leave a Comment
Technical Indicators: A Love-Hate Relationship
January 28, 2012 by Leave a Comment
Part I: How One Technical Indicator Can Identify Three Trade Setup Trading using technical indicators — such as the MACD, for example — can do one of two things: help you or hurt you. Elliott Wave International’s Jeffrey Kennedy explains what he loves and hates about technical indicators and shows you how he uses them […]
Using Moving Averages To Improve Your Trading
June 14, 2011 by Leave a Comment
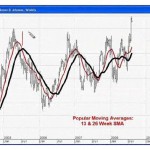
The Trend Is Your Friend: Using Moving Averages To Improve Your Trading By Elliott Wave International Many traders and investors use technical indicators to support their analysis. One of the most popular and reliable also happens to be an indicator that has been around for years and years — moving averages. A moving average is […]
Technical formations made easy
February 17, 2011 by Leave a Comment
This particular technical formation has been around for years and continues to produce good profits for traders who can spot it, and better yet, take advantage of it. In this new short video, I’m going to share the market, the pattern, and a price projection where we think this market is headed based on our […]
Beginner’s Guide To Understanding Market Charts
October 9, 2010 by Leave a Comment
You don’t need computerized technical analysis to understand market trends Being able to “read” a market chart is a rare skill even among professionals. Most investors focus on “the fundamentals”: Things like unemployment numbers, earnings, Fed statements, etc. But just like a picture is worth a thousand words, a chart can tell you a lot […]
Prechter Called the Uptrend ‘Out’ in April
June 9, 2010 by Leave a Comment
Even non-sports fans have heard by now about the recent debacle known as “Baseballgate” — with two outs in the ninth inning, the first base umpire called “SAFE” when the runner was clearly “OUT.” The missed call cost Detroit Tiger pitcher Armando Galarraga a perfect game. But the Biggest, Baddest Call of all was not made on a sports field. It was made in the field of finance — specifically on the stock market. To wit: The mainstream “umpires” of finance stood near first base, and in April made this emphatic call for the uptrend in stocks.
What Do These 8 Technical Indicators Mean for the Markets?
May 7, 2010 by Leave a Comment
Robert Prechter reveals how 8 technical indicators are aligning to form a forecast for the market that’s too urgent to ignore.
U.S. Stocks: Will The Bears Relinquish Control?
February 10, 2010 by Leave a Comment
In case you were hiding out Tiger Woods’ style far away from the mainstream media over last month, let me be the first to say: January saw an abrupt end to the US stock market’s record-setting winning streak. Last count, the Dow Jones Industrial Average plummeted 4% in its worst monthly loss in a full year