Define Yourself: What Kind of Trader Are You? The idea of being a successful trader is exciting. The reality of becoming one is another thing. You need to understand more than the markets — you need to understand yourself. EWI’s Senior Analyst Jeffrey Kennedy knows what it takes. He has analyzed and traded the markets […]
Understanding Fibonacci
October 6, 2011 by Leave a Comment
Learn to apply Fibonacci ratios to calculate price targets in stocks The Fibonacci ratio can be an invaluable tool for calculating price retracements and projections in your analysis and trading. This excerpt from The Best Technical Indicators for Successful Trading explains the origins of the Fibonacci sequence and how you can apply it to the […]
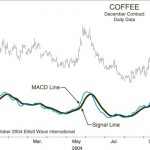
Momentum Analysis Using MACD
September 15, 2011 by Leave a Comment
Learn more about using Momentum analysis to make Elliott wave trading decisions in this video by EWI European Interest Rate Analyst Bill Fox. Find more lessons on technical indicators in EWI’s newest free report. See the information below.
J.P. Morgan and the Beginning of the Central Bank
September 1, 2011 by Leave a Comment
Those Steely-Eyes of J.P. Morgan: Could They Help Us Today? “The Panic of 1907” vs. the “Debt Crisis” of 2011 If “legendary Wall Street figure” ever described anyone, it was turn-of-the-last-century financier J.P. Morgan. You can throw in “bigger than life” to boot. Morgan was used to getting his way. His steely eyes cast a […]
FED Insiders Doubt Quantitative Easing Works
August 26, 2011 by Leave a Comment
Behind Closed Doors at the Fed: Ten Years of Research into America’s Central Bank During the past few years, The Federal Reserve has engaged in a “deliberate inflating policy.” This policy earned disfavor, both at home and abroad. Robert Prechter said this in the July Elliott Wave Theorist: “Foreign powers have been irate over the […]
See Prechter’s “FREE FALL TERRITORY” Chart for Yourself
August 19, 2011 by Leave a Comment
And see EWI’s long-term forecast in the updated “Free Fall” chart In the May 2008 issue of his monthly Elliott Wave Theorist, Robert Prechter showed this chart of the Dow Jones Industrials. As you can see, prices go back to the 1970s. Please note that on the day this chart published (May 16), the Dow […]
Should Stock Investors “Fret Over Economy”? No — See Chart to Understand Why
August 9, 2011 by Leave a Comment
The idea that the economy leads the stock market is false As the DJIA fell 2% to close below 12,000 on August 2, one theme rang across major financial websites. This CNN headline summarizes it: Stocks sink as investors fret over the economy (Aug. 2) The belief that the economy drives the stock market is […]
Read About the Elliott Wave Principle in R.N. Elliott’s Own Words on his Birthday
August 9, 2011 by Leave a Comment
July 28 would have been Ralph N. Elliott’s 140th birthday, so it’s a fitting time to post an excerpt from his essay, “The Basis of the Wave Principle.” There’s nothing like reading for yourself what the discoverer of the Wave Principle wrote about how it works. This essay is taken from the book, R.N. Elliott’s […]
Hooking Potential Trade Set-ups
July 13, 2011 by Leave a Comment
How to Combine Technical Indicators with Elliott Wave Analysis By Elliott Wave International Trading using technical indicators — such as the MACD, for example, Moving Average Convergence-Divergence — can do one of two things: help you or hinder you. Using them as a forecasting method alone can be about as predictable as flipping a coin. […]
Using Elliott Waves: As Simple As A-B-C
July 7, 2011 by Leave a Comment
Two resources from Elliott Wave International can help you get started By Elliott Wave International When Ralph Nelson Elliott discovered the Wave Principle nearly 70 years ago, he explained how social (or crowd) behavior trends and reverses in recognizable patterns. You can learn to identify these patterns as they unfold in the financial markets, and […]