And see EWI’s long-term forecast in the updated “Free Fall” chart In the May 2008 issue of his monthly Elliott Wave Theorist, Robert Prechter showed this chart of the Dow Jones Industrials. As you can see, prices go back to the 1970s. Please note that on the day this chart published (May 16), the Dow […]
Should Stock Investors “Fret Over Economy”? No — See Chart to Understand Why
August 9, 2011 by Leave a Comment
The idea that the economy leads the stock market is false As the DJIA fell 2% to close below 12,000 on August 2, one theme rang across major financial websites. This CNN headline summarizes it: Stocks sink as investors fret over the economy (Aug. 2) The belief that the economy drives the stock market is […]
Read About the Elliott Wave Principle in R.N. Elliott’s Own Words on his Birthday
August 9, 2011 by Leave a Comment
July 28 would have been Ralph N. Elliott’s 140th birthday, so it’s a fitting time to post an excerpt from his essay, “The Basis of the Wave Principle.” There’s nothing like reading for yourself what the discoverer of the Wave Principle wrote about how it works. This essay is taken from the book, R.N. Elliott’s […]
Hooking Potential Trade Set-ups
July 13, 2011 by Leave a Comment
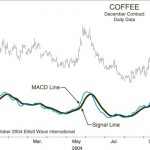
How to Combine Technical Indicators with Elliott Wave Analysis By Elliott Wave International Trading using technical indicators — such as the MACD, for example, Moving Average Convergence-Divergence — can do one of two things: help you or hinder you. Using them as a forecasting method alone can be about as predictable as flipping a coin. […]
Using Elliott Waves: As Simple As A-B-C
July 7, 2011 by Leave a Comment
Two resources from Elliott Wave International can help you get started By Elliott Wave International When Ralph Nelson Elliott discovered the Wave Principle nearly 70 years ago, he explained how social (or crowd) behavior trends and reverses in recognizable patterns. You can learn to identify these patterns as they unfold in the financial markets, and […]
Spotting Trade Setups- A Quick Four-Chart Lesson
June 30, 2011 by Leave a Comment
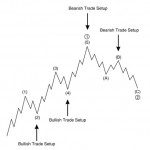
One major key to profitable trading is finding high profitability trade set-ups with a high probability of success. Fortunately, once you understand the Elliottwave patterns finding high probability patterns is much easier. In today’s lesson we have the opportunity to use four simple charts to spot a bear market setup. A Four-Chart Lesson in Spotting Trade […]
When You Trade and Invest, Why Use the Wave Principle?
June 23, 2011 by Leave a Comment
The question: Why use the Wave Principle when trading or investing? The answer: To avoid the herd that usually loses money in the markets. The explanation: Herding makes it difficult to follow the most useful trading advice to buy low and sell high. More often than not, what really happens is that you hear about […]
Using Moving Averages To Improve Your Trading
June 14, 2011 by Leave a Comment
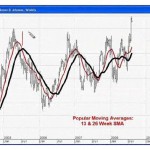
The Trend Is Your Friend: Using Moving Averages To Improve Your Trading By Elliott Wave International Many traders and investors use technical indicators to support their analysis. One of the most popular and reliable also happens to be an indicator that has been around for years and years — moving averages. A moving average is […]
Is It Possible to Have Panic Buying?
May 27, 2011 by Leave a Comment
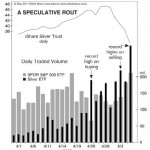
What’s up with Silver lately? In this article Robert Folsom shows us what makes Silver tick and how it has gotten so crazy lately. Tim McMahon, Editor “Panic selling” is easy to understand and recognize: Investors rush to sell from the fear of loss. No more explanation necessary. On the other hand, “panic buying” is not […]
What Does a Fractal Look Like?
May 27, 2011 by Leave a Comment

And What Does It Have to Do with the Stock Market? Fractals are common in nature but you don’t expect them in the stock market. But as you’ll see in this article fractals are found almost everywhere and by understanding them you can better predict the future direction of the stock market. May 26, […]