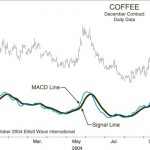
How to Combine Technical Indicators with Elliott Wave Analysis By Elliott Wave International Trading using technical indicators — such as the MACD, for example, Moving Average Convergence-Divergence — can do one of two things: help you or hinder you. Using them as a forecasting method alone can be about as predictable as flipping a coin. […]
Using Elliott Waves: As Simple As A-B-C
Two resources from Elliott Wave International can help you get started By Elliott Wave International When Ralph Nelson Elliott discovered the Wave Principle nearly 70 years ago, he explained how social (or crowd) behavior trends and reverses in recognizable patterns. You can learn to identify these patterns as they unfold in the financial markets, and […]
When You Trade and Invest, Why Use the Wave Principle?
The question: Why use the Wave Principle when trading or investing? The answer: To avoid the herd that usually loses money in the markets. The explanation: Herding makes it difficult to follow the most useful trading advice to buy low and sell high. More often than not, what really happens is that you hear about […]
Using Moving Averages To Improve Your Trading
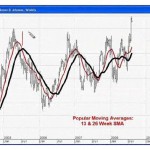
The Trend Is Your Friend: Using Moving Averages To Improve Your Trading By Elliott Wave International Many traders and investors use technical indicators to support their analysis. One of the most popular and reliable also happens to be an indicator that has been around for years and years — moving averages. A moving average is […]
What Does a Fractal Look Like?
And What Does It Have to Do with the Stock Market? Fractals are common in nature but you don’t expect them in the stock market. But as you’ll see in this article fractals are found almost everywhere and by understanding them you can better predict the future direction of the stock market. May 26, […]
Elliottwave For- Where Technical Studies Fall Short
5 Ways the Wave Principle Can Improve Your Trading May 12, 2011 By Elliott Wave International Every trader, every analyst and every technician has favorite techniques to use when trading. But where traditional technical studies fall short, the Wave Principle kicks in to show high-probability price targets. Just as important, it can distinguish high-probability trade […]
Technical formations made easy
This particular technical formation has been around for years and continues to produce good profits for traders who can spot it, and better yet, take advantage of it. In this new short video, I’m going to share the market, the pattern, and a price projection where we think this market is headed based on our […]
Trendlines: How a Straight Line on a Chart Helps You Identify the Trend
Technical analysis of financial markets does not have to be complicated. Here are EWI, our main focus is on Elliott wave patterns in market charts, but we also employ other tools — like trendlines. A trendline is a line on a chart that connects two points. Simple? Yes. Effective? You be the judge — once […]
How a Simple Line Can Improve Your Trading Success
The following trading lesson has been adapted from Jeffrey Kennedy’s eBook, Trading the Line – 5 Ways You Can Use Trendlines to Improve Your Trading Decisions. Now through February 7, you can download the 14-page eBook free. Learn more here. “How to draw a trendline” is one of the first things people learn when they […]
Simple Tools Separate Us From Animals
Improve your Financial Decision-Making Skills By EWI Chief Commodity Analyst Jeffrey Kennedy. As a high school freshman, I had a friend over to do math homework after school. It was cold in the room, so I stood on my chair and jumped up and down to try and bat open a closed heating vent. My dad […]


