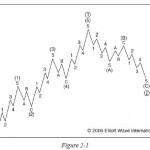
The Personality of Stock Market Waves Each Elliott wave has its own “personality.” In this video Wayne Gorman shows the psychology behind the waves and how it affects your investment decisions. See how the market swings from extreme pessimism through a sense that we are going to survive resulting in cautious optimism but then pessimism returns […]
Using Moving Averages To Improve Your Trading
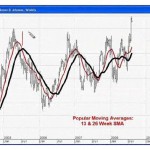
The Trend Is Your Friend: Using Moving Averages To Improve Your Trading By Elliott Wave International Many traders and investors use technical indicators to support their analysis. One of the most popular and reliable also happens to be an indicator that has been around for years and years — moving averages. A moving average is […]
Is It Possible to Have Panic Buying?
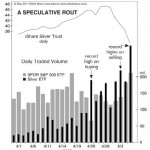
What’s up with Silver lately? In this article Robert Folsom shows us what makes Silver tick and how it has gotten so crazy lately. Tim McMahon, Editor “Panic selling” is easy to understand and recognize: Investors rush to sell from the fear of loss. No more explanation necessary. On the other hand, “panic buying” is not […]
What Does a Fractal Look Like?
And What Does It Have to Do with the Stock Market? Fractals are common in nature but you don’t expect them in the stock market. But as you’ll see in this article fractals are found almost everywhere and by understanding them you can better predict the future direction of the stock market. May 26, […]
Elliottwave For- Where Technical Studies Fall Short
5 Ways the Wave Principle Can Improve Your Trading May 12, 2011 By Elliott Wave International Every trader, every analyst and every technician has favorite techniques to use when trading. But where traditional technical studies fall short, the Wave Principle kicks in to show high-probability price targets. Just as important, it can distinguish high-probability trade […]
Trendlines: How a Straight Line on a Chart Helps You Identify the Trend
Technical analysis of financial markets does not have to be complicated. Here are EWI, our main focus is on Elliott wave patterns in market charts, but we also employ other tools — like trendlines. A trendline is a line on a chart that connects two points. Simple? Yes. Effective? You be the judge — once […]
How a Simple Line Can Improve Your Trading Success
The following trading lesson has been adapted from Jeffrey Kennedy’s eBook, Trading the Line – 5 Ways You Can Use Trendlines to Improve Your Trading Decisions. Now through February 7, you can download the 14-page eBook free. Learn more here. “How to draw a trendline” is one of the first things people learn when they […]
Video: The Versatility of the Wave Principle
Timeless Trading Lesson In the video below, EWI senior analyst and trading instructor Jeffrey Kennedy shows how the Wave Principle can help you identify a high-probability trade set up regardless of the direction of the larger trend. This timeless educational video was taken from Jeffrey’s renowned Trader’s Classroom series and is being re-released because of […]
Beginner’s Guide To Understanding Market Charts
You don’t need computerized technical analysis to understand market trends Being able to “read” a market chart is a rare skill even among professionals. Most investors focus on “the fundamentals”: Things like unemployment numbers, earnings, Fed statements, etc. But just like a picture is worth a thousand words, a chart can tell you a lot […]


