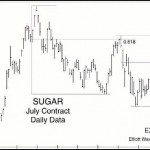
The primary Fibonacci ratios that I use in identifying wave retracements are .236, .382, .500, .618 and .786. Some of you might say that .500 and .786 are not Fibonacci ratios; well, it’s all in the math. If you divide the second month of Leonardo’s rabbit example by the third month, the answer is .500, 1 divided by 2; .786 is simply the square root of .618.
How to Find Trading Opportunities in ANY Market: Fibonacci Analysis
September 17, 2014 by Leave a Comment
15 Hand-Picked Charts to Help You See What’s Coming in the Markets
December 27, 2013 by 1 Comment
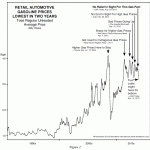
Everyone uses gas: See this chart that shows why its price is heading lower By Elliott Wave International Have you ever seen price charts that tell a story clearly? Here is a perfect example from Robert Prechter’s most recent monthly publication, The Elliott Wave Theorist. By combining headlines from newspapers with the price chart for […]
Spot High-Confidence Trading Opportunities Using Moving Averages
November 22, 2013 by Leave a Comment
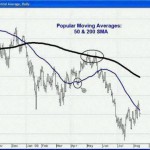
High confidence trading opportunities are those trade set-ups that have a high probability of resulting in a profitable trade. Of course, not every trade will be profitable but finding those with the best chance for success will put the odds in your favor. In previous issues we have looked at a variety of ways […]
Using a High-Confidence Elliott Wave Pattern- The Ending Diagonal
November 12, 2013 by 1 Comment
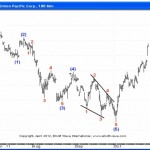
By Elliott Wave International Senior Analyst Jeffrey Kennedy is the editor of Elliott Wave Junctures trader education service and is a very popular instructor. Jeffrey has taught thousands how to improve their trading through his online courses, his international speaking engagements, and in his trader education service Elliott Wave Junctures. Today, he shares a video […]
How to Identify Turning Points in Your Charts Using Fibonacci
November 1, 2013 by Leave a Comment
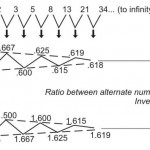
Leonardo Fibonacci (aka. Leonardo of Pisa) was the son of a merchant and well educated in the use of numbers while keeping his father’s books but in those days all of Europe used “Roman Numerals” and calculations were difficult. Leonardo was instrumental in bringing the Arabic numeral that we use today to Europe. But although […]
Learn to Spot a Head & Shoulders Pattern in Your Charts (Video)
October 24, 2013 by Leave a Comment
A Trading Lesson from Elliott Wave International’s Jeffrey Kennedy By Elliott Wave International Senior Analyst Jeffrey Kennedy is the editor of our Elliott Wave Junctures trader education service and one of our most popular instructors. Jeffrey’s primary analytical method is the Elliott Wave Principle, but he also uses several other technical tools to supplement his analysis. […]
The Non-linearity of Market Trends, and Space Programs
August 22, 2013 by Leave a Comment

Linear projections will often take you down the wrong path By Elliott Wave International Let’s begin with the old paradox: “The only constant is change.” This is the main reason why projecting present conditions into the financial future so often fails. If someone had asked you in 1972 to project the future of China, would […]
The 3 Essential Parts of Elliott Wave Trading
July 16, 2013 by Leave a Comment
Educational trading lessons from “Visual Guide to Elliott Wave Trading” When it comes to improving your wave-based analysis and technical trades, three steps may sound simple enough. Yet if you have any experience trading, you know that nothing about trading is easy. Senior Analyst Jeffrey Kennedy knows that it takes skill, discipline and courage to […]
Gold and Silver: A Great Day to be a Bear
June 21, 2013 by Leave a Comment
Elliott wave analysis is the blade-proof glove with which “to catch a falling knife” By Elliott Wave International In the wee morning hours before dawn on Thursday, June 20, the precious metals’ rooster crowed, “Cock-a-doodle-DOH!” It was the ultimate wake-up call: First, gold prices plummeted 4% then 5% then 6% below $1300 per ounce to […]
The 2 Most Important Keys to Successful Trading
June 20, 2013 by Leave a Comment
Examples from Whole Foods Market and Reynolds American, Inc show you what to do (or not) to trade successfully with Elliott Wave By Elliott Wave International After 20 years of experience applying the Elliott Wave Principle, Senior Analyst Jeffrey Kennedy says that it remains the one tool that will tell him — down to the […]