
“When the alarm goes off and the dreamers awake, it will be pandemonium in the stock market.” — Bob Prechter
How to Use the Stochastic Oscillator
July 24, 2015 by Leave a Comment

The stochastic oscillator is a popular tool for analyzing a market. Watch the video to learn how you can use this indicator in your trading. Another way to use Stochastic is as a trend analysis tool. In the following video Jeffrey gives a good explanation of the terms “overbought” and “oversold”. He says these two terms are responsible for more lost money among rookie traders than anything else. So watch the video and get some great tips on using stochastics in your trading.
The U.S. Dollar’s 2014-2015 Rally
July 4, 2015 by Leave a Comment
Let’s look at the 2014-15 Dollar rally and how the Elliott Wave Principle applies to Currencies and Foreign Exchange (Forex). I always say trading forex markets is like riding a bike — except that said bike has one flat tire and the ground beneath it is covered in ice.
So why is Forex so popular, you might ask? In fact, forex is the most liquid market on earth, where trillions of dollars change millions of hands every day.
The reason people are so willing to ride that bike — so to speak — is because if you can stay on, the rewards are often unmatched. The trick, of course, is staying on.
The Disruptive New Science that Shatters Today’s Investing Paradigm
June 17, 2015 by Leave a Comment
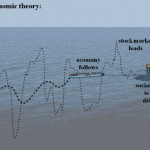
This article was excerpted from a new multimedia report, “The New Financial Theory that Could Make the Difference in Your Investing Success,” (You may watch the excerpt as a video presentation below or if you prefer continue reading the excerpt below the video.)
EURUSD: Why Recent Ups and Downs Are NOT Random
April 9, 2015 by Leave a Comment
How do you know what “your” forex market will do tomorrow? You don’t. All anyone can do is guess. But some guesses are more “educated” than others…
“Markets are doing what they are supposed to be doing: inflicting the most pain on the most number of people. Markets fool the most number of people at the most unexpected moments, but by tracking Elliott wave patterns, sentiment (and the news) you can prepare yourself.”
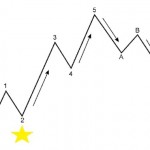
The Basics of Corrective Waves
March 26, 2015 by Leave a Comment
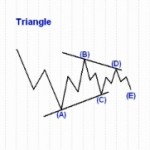
The first distinction in Elliott Wave Analysis is between “motive” and “corrective” waves. The primary focus of this lesson is the corrective waves. Corrective waves can be either “ZigZag”, “Flat” or “Triangle”.
What Stock Market Bulls Might Be Overlooking- Video
March 4, 2015 by Leave a Comment
A growing economy is not necessarily bullish — see for yourself. If a strong economy means a strong stock market, then stocks should have continued higher in 2007 when GDP expanded at 2.7%, unemployment was 4.6% and Consumer confidence was very strong, . They didn’t, instead the Dow fell more than 50% over the next year and a half:
Warren Buffett says, The Market is a “Drunken Psycho”
January 17, 2015 by Leave a Comment
When we look at the recent volatility of the market it is easy to become depressed, confused or just plain frustrated (or perhaps even a little of each). Even the legendary investor Warren Buffet says the market is like a “Drunken Psycho”, so what are mere mortals like ourselves to do? In today’s post we get a little peek into how to beat the market.
Using Trend Lines and Identifying Support and Resistance
January 12, 2015 by 2 Comments
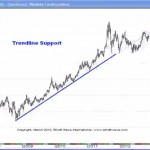
One of the most basic skills necessary when looking at a stock chart is using trend lines and identifying support and resistance. Unfortunately, sometimes as we learn more sophisticated methods we tend to forget the basics. So if you are just starting in the markets or you are a more advanced trader, you may find this information valuable.
Top Approaching in Berkshire Hathaway?
October 9, 2014 by 1 Comment
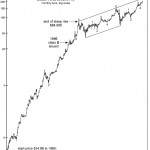
By Elliott Wave International Editor’s note: The following article originally appeared in a special September-October double issue of Robert Prechter’s Elliott Wave Theorist, one of the longest-running financial letters in the business. It piques our interest when a person or company makes the front page of a magazine or newspaper. On August 15, USA Today […]