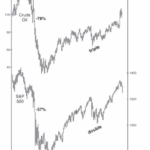
It makes sense that falling oil prices would be good for stocks, after all it should lower company’s cost for energy and therefore increase profitability. However, in October 2018 both Oil prices and Stock prices fell simultaneously. So, “What’s Up with that?” In today’s post the Editors at Elliott Wave International will look at the relationship between Oil and Stocks.
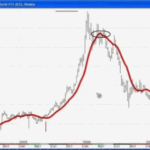
Moving Averages Help You Define Trend – Here’s How
The “moving average” is a technical indicator of market strength which has stood the test of time.
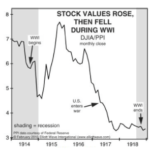
Are Wars Bullish or Bearish for Stocks?
The following article was originally published by Elliott Wave International under the title Is War “Hell” for the stock market? And it looks at the stock market performance during various wars and also during times of peace to see if there is a correlation between the market performance and the existence or absence of war.
Urgent Message: Two Must See NASDAQ Charts
The NASDAQ index was launched in 1971 as the world’s first electronic stock market. With $7 Trillion in market capitalization it has grown to become the second largest market behind the NYSE. The NASDAQ has been in an upward sloping channel since 2011. But now something has happened. See this video for more information.
Bitcoin Crashes Below $10,000. What’s Next?
Who could have thought that something called a “digital currency” that first appeared in 2009 and was widely available for 1 cent (and no one cared!) eight years later would be going for $20,000 a pop? It’s the wildest financial craze of our time. Wait, scratch that — it’s the wildest financial craze ever, because Bitcoin is up not 100%, not 1,000%, not even 10,000%. Since inception, Bitcoin is up 32,000,000%. Yes, thirty-two MILLION percent.
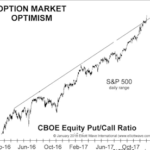
U.S. Stocks: A Sentiment Extreme You MUST Pay Attention to
Robert Kelley, the editor of Elliott Wave International’s US Stocks Intraday Pro Service, tells you about a sentiment extreme that he’s seen recently. Watch this new interview to find out what has caught his attention and what they mean for U.S. stocks going forward.
Did You See the 30% Rise in This Major Global Stock Index?
In this video Robert Folsom shows the indicators leading the Hong Kong Hang Seng Index to gain 30% in 9 months.
Silver Chart of the Day
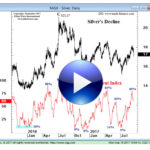
Silver has had several major peaks over the last year. But interestingly sentiment has been an excellent indicator of peaks. In this video we will look at the correlation between Silver’s price and market sentiment.
What Does “Paddle-boarding” Have to do with Speculating?
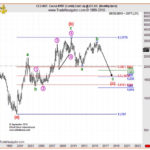
Sometimes when your mind is in the “Zone” unusual correlations will just pop into your head. According to Wikipedia, “The eureka effect (also known as the aha! moment or eureka moment) refers to the common human experience of suddenly understanding a previously incomprehensible problem or concept.” An editor of Elliott Wave International had a eureka aha moment while paddle-boarding and in this article, he looks at Elliott Wave Setups, Cocoa and surprisingly how that correlates to of all things Paddle Boarding. ~ Tim McMahon, editor.
