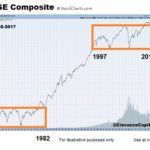
In the following article Chris Ciovacco of Ciovacco Capital Management takes a look at the big picture of the stock market. It is very possible the stock market’s behavior between 2016 and 2034 will be significantly different from its behavior between 1997 and 2015. Therefore, our approach to the markets needs to be flexible enough to handle the possibility of much stronger and sustained trends than what we have seen in our investment lifetimes.
How Concerning Are Predictions Of A Stock Market Crash?
June 13, 2017 by Leave a Comment
Since markets are an extremely difficult and complex animal, our purpose here is not to criticize anyone, but rather to highlight the “grain of salt” nature of any stock market forecast. The dated headlines below featured similar gloom and doom calls, and yet, global markets remain near all-time highs.
Are Defensive Assets Waving Red Flags For Stocks?
May 3, 2017 by Leave a Comment
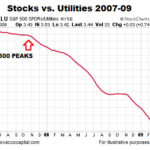
In good times for the market “growth” stocks, the NASDAQ and higher risk assets outperform “safe” stocks like the S&P 500. This is commonly referred to as “Risk-On”. But as the market becomes more cautious and participants are more concerned about the return OF their assets vs. the return ON their assets, they shift away from risky assets and towards Bonds, Utilities, and Gold.
In the series of charts below Chris Ciovacco of Ciovacco Capital Management looks at how defensive assets are faring in the current market compared to how it performed in 2007-2009.
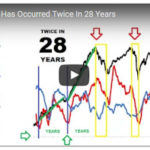
This indicator had a divergence in both 2000 and 2007; a divergence is also present in 2017
April 27, 2017 by Leave a Comment
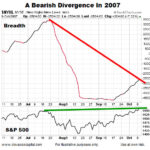
Market breadth speaks to the number of stocks participating in an advance. Strong market breadth means a high percentage of stocks are making new highs as the major indexes make new highs. Strong breadth also aligns with widespread confidence in stocks and the economy.
How Concerning Is The S&P 500’s Pullback?
April 17, 2017 by Leave a Comment
This week’s video reviews the impact of the recent pullback on the longer-term outlook. The video also covers the emotional impact of portfolio draw-downs.
Will Stocks Finally Break out of the 35 Year Box?
March 7, 2017 by Leave a Comment
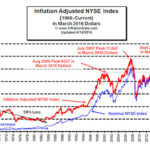
Despite all the talk of the Dow making new highs over the last few years the truth is actually quite different. The way an index is “weighted” can make all the difference in how it looks. In addition indexes that change their composition regularly like the DOW (i.e.removing some companies and adding better performing ones) create an unnatural upward bias.
Rare Signal Says Stock Rally Is The Real Deal
February 28, 2017 by Leave a Comment
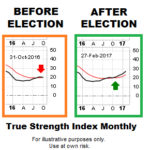
Only Three Other Occurrences Since 2002
The True Strength Index (TSI) is a momentum oscillator based on a double smoothing of price changes. As shown in the monthly S&P 500 graph below, a positive momentum crossover (black moves above red) has only occurred four times since 2002. In the three previous cases, the S&P 500 rallied for a long period of time after the crossover; the average gain was 52%.
Is Warren Buffett Bullish or Bearish Now?
February 7, 2017 by Leave a Comment
Actions Speak Louder Than Words — If you want to know what someone really thinks about the stock market, look at their recent portfolio transactions. What can we learn from recent moves made by two of the world’s most respected value investors?
Is Dow Theory Telling Us The Stock Rally Is Going To Fail?
August 27, 2016 by Leave a Comment
The Dow Jones Transportation Average has failed to print a new high above the previous high made in 2015. Given the Dow has made a new high, a Dow Theory non-confirmation remains in effect.
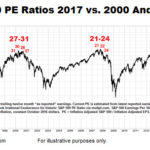
How Does 2016 Compare To Stock Market Peaks In 2000 And 2007?
August 15, 2016 by Leave a Comment
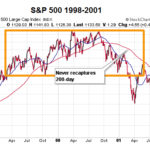
How does the current 50 day and 200 day moving average on the S&P 500 compare from previous crashes with the current market situation?