The market soared 27% since the December low. And continued despite the media beating the gloom and doom drum of the “Debt Ceiling”.
The Market is Currently a “Mixed Bag”
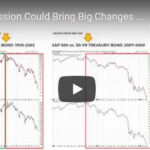
In the following video, Chris Ciovacco of Ciovacco Capital Management looks at several market indicators and the recent rebound.
The Journey to High-Confidence Trading Starts Now!
Next Stop: Corrective Elliott Wave Patterns
Soybeans and Apple stock (AAPL): Corrective patterns signaled opportunities in these disparate markets. Your market could be next!
By Elliott Wave International
The last 2 years have been a time of immense global adversity with the most challenging human health crisis in over a century.
But it has also been a time of immense personal growth. The uncomfortable realization of our dependence on others for everything from entertainment, education, nourishment, and income came into stark, swift focus. And with it, how quickly those things can be taken away without warning because of that dependence.
In turn, the pandemic saw an insatiable industry of online self-improvement crash courses emerge on home garden horticulture, podcast making, home building, home schooling, and — learning to trade financial markets to “ensure a steady livelihood despite economic setbacks.”
The problem is, learning to trade isn’t like learning to plant tubers in your backyard. It’s much more complicated and can’t be fully conveyed with mock “trials” or simulated positions. At best, many of such courses get people in the door, but not seated at the table of real-world practice and risk-management.
That’s where our respected partner Elliott Wave International (EWI) comes in. Its team of market analysts and technical analysis instructors has committed itself to leading the most comprehensive educational journey of the company’s 42-year long history.
EWI’s ultimate goal for 2022: Empower market newbies and veterans alike to develop and deepen their opportunity-spotting skills through the independent forecasting model known as Elliott wave analysis.
In brief, Elliott wave analysis, aka the Wave Principle, is founded on these core observations:
Market trends are driven by trends in collective investor psychology
Investor psychology progresses in 2 modes, impulsive and corrective
Correctly identifying these patterns at their onset illuminates future price action
One such mode of market progress is the correction, which is best defined by the “bible” of all things Elliott, Elliott Wave Principle — Key to Market Behavior:
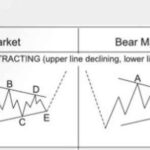
“Markets move against the trend of one greater degree only with a seeming struggle. Resistance from the larger trend appears to prevent a correction from developing a full motive structure… Specific corrective patterns fall into three main categories: Zigzag, flat and triangle.”
NASDAQ Signal Has Only Occurred 15 Times In Last 42 Years
Fifteen times in Forty-Two years is about once every 8½ years. That makes it a relatively rare occurrence. In today’s video, Chris Ciovacco of Ciovacco Capital Management looks at the recent MACD cross. The first MACD cross which occurred in September 2018 reveals the beginning of a countertrend movement in the prevailing uptrend. But when the “black” MACD line crossed below the zero line in November we get what looks like a confirmation of the switch from a countertrend movement to a full downtrend movement.
But on March 8th 2019, we see the “black” MACD line crossing back above the zero line. Thus we see the relatively rare signal as follows, “MACD crosses below the centerline on a weekly closing basis and stays below for at least 3.5 to 4 months, and then closes back above the zero line”… this makes it look more like a new uptrend rather than a countertrend rally.
The Stock Market Big Picture
One of the keys to making more prudent and rational decisions is to look at more than just the red screen in front of us, which represents only one timeframe (the shortest). It can also be helpful to think in extremes.
Urgent Message: Two Must See NASDAQ Charts
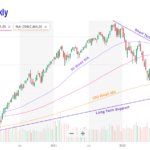
The NASDAQ index was launched in 1971 as the world’s first electronic stock market. With $7 Trillion in market capitalization it has grown to become the second largest market behind the NYSE. The NASDAQ has been in an upward sloping channel since 2011. But now something has happened. See this video for more information.
