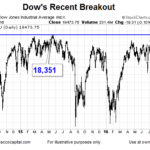
A retest of prior resistance may be in the cards, which is exactly what happened in early 1995. In 2016, the Dow Jones Industrial Average (below) may be in retest mode.
Stocks And Bonds- Testing Key Areas
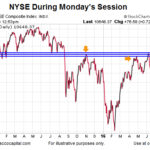
While the S&P 500 (SPY) was able to push to a new high during Monday’s trading session, the broad NYSE Composite Stock Index (VTI) was still looking for a close above an area that acted as resistance in the past.
Stocks Sideways While Earnings Tank
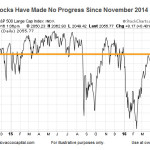
Stocks have been flat for 17 months while earnings are declining.
They Don’t Ring a Bell at Market Tops (or Bottoms)
Recently I read the following comment on a post about investing in Gold:
Isn’t buying Gold today just like buying a horse ?
It being a purely romantic move for an object with no current use.
Sure it looks pretty and it will still get you there, though slowly,
but why would anyone have it as their primary source of investment travel ?
And I got to thinking that maybe comments like that are the “Bell” that rings indicating a new buying opportunity is at hand. In response I wrote an article entitled, Where’s Gold Headed Today? At the time of the comment, Gold had just finished trading at $1050 and by the time I wrote the article, gold was trading at $1100. As of this writing gold is trading at $1220. So it appears that the commentor made it statement at the precise bottom. But then gold tends to be an “emotional” investment with crazy statements at both the bottom and top. Personally, I think these outlandish comments are more reliable if they come from the general public rather than from seasoned investors.
I remember attending a seminar for computer network professionals in early 2000 and during every break all they could talk about was how they were going to retire on their 401k stock gains which exceeded their salaries. There’s an old saying that “It’s time to sell when the bag boy at the grocery store is giving you stock tips”. Although these guys weren’t “bag boys” they certainly weren’t investing pros either.
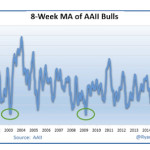
In the following article Chris Ciovacco gives us a different perspective about market sentiment… and gives us this excellent reminder… “Sentiment, like many pieces of evidence can be helpful, but like anything else it should not be used in isolation.” ~Tim McMahon, editor
Bonds Continue To Flash Warning Signs For Stocks
When investors are fearful, common sense tells us demand picks up for more conservative assets, which is exactly what happened early Monday morning. When investors are very pessimistic and fearful, return of principal becomes highly important. Therefore, when fear increases we would expect to see defensive bonds outperform growth-oriented stocks.
How Is The Bullish 1994 Stock Analogy Holding Up?
In today’s post Chris Ciovacco of Ciovacco Capital gives us some interesting insight into the current market situation and answers the question:
Is the Market Rallying or is it just a “counter-trend” rally?
He also discusses the three Market myths
And he has a great instructional video at the end.
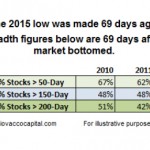
Stock Market Breadth: Is It Really That Bad?
Market breadth speaks to the percentage of stocks participating in a stock market rally. All things being equal, the broader the participation the healthier the market. In this article, we will examine breadth for both the S&P 500 and NYSE Composite Stock Index. We will also examine 2015 breadth vs. similar points after a correction and similar points in a bear market. Stock market breadth is not particularly useful as a short-term timing tool for the S&P 500; it can be helpful on longer-term time horizons.
Retesting Market Lows Seeking Support
Given the severity of the selloff in stocks in late August, it was not surprising to see the subsequent rally attempts fail. As we noted numerous times in recent weeks, including September 3 and September 17, bottoms tend to be a process.
Greece: What Do Investors Need To Know About Risk?
Greece’s biggest newspapers called on readers to vote “Yes” in Sunday’s referendum that could determine whether the country stays in the euro. European leaders say a ‘No’ vote will jeopardize the euro. Prime Minister Alexis Tsipras says they are bluffing, what do investors need to know?
Fibonacci Levels Create Key Support for S&P 500
Math plays a big role in nature and the financial markets. Many trading algorithms use Fibonacci retracement levels to identify areas where buyers may become interested (support). The math below may be helpful to us in the coming days – at a minimum, it is prudent to be aware of the possibility of a bounce near 1976 should the market test that area:
