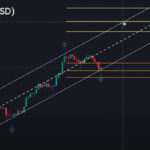
Today we have an in-depth Elliott Wave analysis of the Bitcoin Chart from Crypto Unplugged.
This excellent analysis looks at several ways to determine a potential top for Bitcoin and where we currently are in the cycle. The First analysis uses channels and Fibonacci Time Pivots.
Elliott Wave Analysis of Bitcoin
Bob Prechter on the Rich Dad Radio Show
Our friends at Elliott Wave International just published an interesting interview between Rich Dad Radio Show guest host Tom Wheelright and EWI Founder and President Bob Prechter.
Free report: ‘Gold Investors’ Survival Guide’
Gold prices are breaking records so our friends at Elliott Wave International have created a free guide to help you get on the right track.
Market Outlook May 31, 2023
The market soared 27% since the December low. And continued despite the media beating the gloom and doom drum of the “Debt Ceiling”.
Where is the Market Headed in May 2023
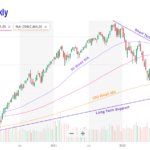
As we’ve been saying for a while now, the market is stuck in a pennant formation and will eventually have to break out one way or the other, and generally, when that type of breakout occurs, it is quite sharp.
Silicon Valley Bank, Silvergate and “The Everything Bust”
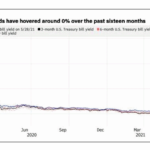
the FED’s raising interest rates has resulted in an “inverted yield curve” (i.e. short rates are higher than long interest rates) which puts extreme stress on banks and has resulted in some recent bank failures. In this article, the editors of Elliott Wave International look at the banking situation. ~Tim McMahon, editor
Bull Trap or Market Consolidation?
At the end of last week, Chris Ciovacco recorded his weekly “Short-Takes” market analysis, and overall, things looked quite bullish. Most markets were above their moving averages, trends were turning up, and things were looking good. And then this week, markets turned down, and things got gloomier. But as we’ve said before, Stocks Don’t Go Straight Up (or Straight Down), and Chris said last week that he wouldn’t be surprised to see the markets like the S&P 500 retest the 3900-3950 levels. This is all part of a healthy consolidation. Of course, if markets fall below certain levels, we must reevaluate our position and see if the 2023 rally was just a “Bull Trap” after all. We should remember that the FED is still tightening, and we know “fighting the FED” is generally a bad idea.
60% stocks, 40% bonds? Ha!
Traditional wisdom suggests a quick and easy “Balanced Portfolio” of 60% stocks and 40% bonds. But there are pitfalls to this type of quick and dirty balancing. Theoretically, when stocks fall, bonds should rise or at least maintain their value. More advanced balancing systems might add a Gold or precious metals component of perhaps 10%. Still, further refinement can decrease the stock portion and increase the bond portion as you get closer to retirement age. On average, a 20-year-old has a lot longer to recover from a market downturn than an 80-year-old. So, a younger person can accept higher risk in return for a higher reward, so a 20-year-old might have 80% in stocks and 20% in bonds. An 80-year-old, on the other hand, might have 80% in Bonds and 20% in stocks. In the following article, the Editors at Elliott Wave International look at some of the pitfalls of the balanced portfolio approach. ~ Tim McMahon, editor
Are You Prepared for Widespread Bank Failures?
“This time, the world economy appears to be on much shakier footing”. The ideal time to prepare for almost anything in life, especially a potential circumstance that’s adverse, is before it happens. The problem is: Many people don’t know what will happen in their lives ahead of time.
However, sometimes warnings are provided yet they’re ignored or not taken seriously. A current warning from Elliott Wave International which people are urged to take very seriously is that the economic slowdown could morph into something far worse than a garden-variety recession.
What the “Housing Busts” Indicator Is Saying Now
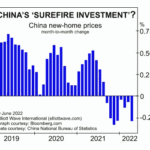
The housing market tends to go the way of the stock market, and nearly everyone knows that the stock market has been sliding… Homes sales have already begun to decline:
U.S. existing home sales fall for third straight month; house prices at record high (Reuters, May 19)
Sales of existing homes fell in May, and more declines are expected (CNBC, June 21)
Sales of luxury homes in some areas have dropped significantly. As examples, in Nassau County, NY, Oakland, CA, Dallas, TX, Austin, TX and West Palm Beach, FL, annual drops in the rate of upper-end home sales for the three months ended April 30 stretched from 32.8% to 45.3%.
