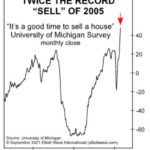
Is the Correction Over Yet?

Last week Chris Ciovacco of Ciovacco Capital Management posted a video with his always thorough analysis considering whether this was the last hurrah before a major bear market or the final
test of support before the market resumed its uptrend. He entitled it “Trend Exhaustion or Eminent Plunge” . At around the 5:35 point, that video explains the Demark Studies “9-13” setup for
a reversal and how it plays into this week’s analysis. “9-13” signals on the downside are relatively rare but we got one in May. So, we need to keep an open mind to the possibility of a reversal to
the upside. Even though from a sentiment perspective or even a fundamental perspective it is very difficult to see how any good can be in the pipeline.

Why Investors are Consistently Fooled by the Stock Market

Stock market observers are trying to “make sense” of the wild price moves, which have mainly been to the downside.
As a May 12 CNBC headline says:
Traders search for answers as relentless selling on Wall Street looks to be detached from reality
Many market participants believe the “reality” of economic statistics, earnings and other factors external to the market govern the market’s trend.
However, that’s a fallacy.
Let’s get insights from a classic Elliott Wave Theorist, a monthly publication which provides analysis of financial markets and social trends:

Is Bitcoin Headed to Zero?

During the 2008 meltdown gold initially lost value as speculators sold gold to cover margin calls. But it quickly recovered as investors realized that gold was the only asset that wasn’t simultaneously someone else’s liability. So the question arises, “Will Bitcoin turn out to be an Asset or a Liability”?

Predicting the Collapse of a “Parabolic Rise”

Sometimes an Elliott wave practitioner must adjust the wave count as a market’s action unfolds. After all, the Wave Principle is an “exercise in probability.” Having said that, the Wave Principle can sometimes offer amazingly “precise results.” And sometimes, the upward trajectory of a stock’s price seems to defy gravity. But “parabolic rises” are impossible to sustain.

The Journey to High-Confidence Trading Starts Now!

Next Stop: Corrective Elliott Wave Patterns
Soybeans and Apple stock (AAPL): Corrective patterns signaled opportunities in these disparate markets. Your market could be next!

By Elliott Wave International

The last 2 years have been a time of immense global adversity with the most challenging human health crisis in over a century.

But it has also been a time of immense personal growth. The uncomfortable realization of our dependence on others for everything from entertainment, education, nourishment, and income came into stark, swift focus. And with it, how quickly those things can be taken away without warning because of that dependence.

In turn, the pandemic saw an insatiable industry of online self-improvement crash courses emerge on home garden horticulture, podcast making, home building, home schooling, and — learning to trade financial markets to “ensure a steady livelihood despite economic setbacks.”

The problem is, learning to trade isn’t like learning to plant tubers in your backyard. It’s much more complicated and can’t be fully conveyed with mock “trials” or simulated positions. At best, many of such courses get people in the door, but not seated at the table of real-world practice and risk-management.

That’s where our respected partner Elliott Wave International (EWI) comes in. Its team of market analysts and technical analysis instructors has committed itself to leading the most comprehensive educational journey of the company’s 42-year long history.

EWI’s ultimate goal for 2022: Empower market newbies and veterans alike to develop and deepen their opportunity-spotting skills through the independent forecasting model known as Elliott wave analysis.

In brief, Elliott wave analysis, aka the Wave Principle, is founded on these core observations:

Market trends are driven by trends in collective investor psychology
Investor psychology progresses in 2 modes, impulsive and corrective
Correctly identifying these patterns at their onset illuminates future price action

One such mode of market progress is the correction, which is best defined by the “bible” of all things Elliott, Elliott Wave Principle — Key to Market Behavior:

“Markets move against the trend of one greater degree only with a seeming struggle. Resistance from the larger trend appears to prevent a correction from developing a full motive structure… Specific corrective patterns fall into three main categories: Zigzag, flat and triangle.”

Is the Correction Over?

After a fairly rapid correction in January 2022, the market has started to rebound. So does that mean it’s safe to jump back into the market? After all, we saw a worse crash in January 2020 followed by a rapid rebound to new highs. And even the 2018 correction was short-lived. So have market participants become accustomed to quick rebounds? Or is this just a brief counter-trend rally?

Has Crypto-Mania Finally Run Its Course?

Typically when a Company gets naming rights to a sports stadium or their President gets to ring the bell at the New York Stock Exchange that company is at the top of its game. Unfortunately, when you are at the top there is nowhere to go but down. In today’s article, we are going to look at tops, tech, crypto, and stadiums.

A Change May Be Nigh for Real Estate

House buyers want to buy at a favorable price, house sellers want to get the most for their property. But for the past several months — across the country — buyers have often had a tricky time finding a reasonably priced home. A recent headline says, “home prices have risen 100 times faster than usual.” And on InflationData we just updated the Inflation-Adjusted Real Estate Index adding data all the way back to 1890. We look at the idea that housing prices “always go up”.

“Kiss of Death” Stock Market Indicator

Government regulations require the disclaimer that “Past Performance is not a Guarantee of Future Results” but certain events tend to trigger other events. Or if they don’t trigger them they have similar causes or perhaps one is just an indicator that the other is in progress. Wise stock investors are always on the lookout for these types of indicators so they can be properly invested for the upcoming event.  In today’s article, we are going to look at an indicator that often (not always) precursors a market crash.

The Maniacal Residential Real Estate Market

If you’ve heard anything about Real Estate in the last year you’ve heard about how crazy the market is getting. People are buying houses sight-unseen for more than the asking price. It’s just crazy. Anyone who has ever experienced any sort of bubble mentality knows that this is exactly what a bubble feels like. The problem with bubbles of course is that they always last longer and go higher than a rational person would think possible. And I guess that is sort of the point… a bubble occurs when prices are no longer rational. The tricky part is knowing when the bubble is going to pop. This reminds me of the old saying that says “it is better to get out a month too early than a day too late.” The following video talks about the condition of the current Real Estate market and indicators of a top.