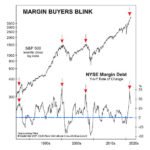
Government regulations require the disclaimer that “Past Performance is not a Guarantee of Future Results” but certain events tend to trigger other events. Or if they don’t trigger them they have similar causes or perhaps one is just an indicator that the other is in progress. Wise stock investors are always on the lookout for these types of indicators so they can be properly invested for the upcoming event. In today’s article, we are going to look at an indicator that often (not always) precursors a market crash.
The Maniacal Residential Real Estate Market
August 21, 2021 by Leave a Comment
If you’ve heard anything about Real Estate in the last year you’ve heard about how crazy the market is getting. People are buying houses sight-unseen for more than the asking price. It’s just crazy. Anyone who has ever experienced any sort of bubble mentality knows that this is exactly what a bubble feels like. The problem with bubbles of course is that they always last longer and go higher than a rational person would think possible. And I guess that is sort of the point… a bubble occurs when prices are no longer rational. The tricky part is knowing when the bubble is going to pop. This reminds me of the old saying that says “it is better to get out a month too early than a day too late.” The following video talks about the condition of the current Real Estate market and indicators of a top.
Why U.S. Corporate Bankruptcies Could Skyrocket
July 7, 2021 by Leave a Comment
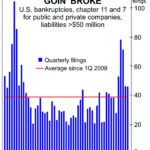
Typically, as you would expect, corporate bankruptcies occur most frequently when the economy is bad. Marginal companies that were just hanging on in “good times” are the first to fail as money gets tighter. The last spike in corporate bankruptcies was in the aftermath of the 2008 crisis. But in 2020, we saw another spike in bankruptcies from a different cause, i.e. COVID shutdowns. Despite government subsidies, bankruptcies soared, the economy tanked, and millions of people sat home and collected enhanced benefits. So now that we are halfway through 2021, how are we faring?
Why “Trouble is Brewing” for the U.S. Housing Market
July 1, 2021 by Leave a Comment
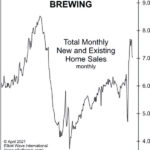
We keep hearing about the “Housing Madness” that shows “No Signs of Slowing.” A would-be renter offered $2 million for a summer rental in the Hamptons and was turned down! Still, there are subtle but important signs of trouble in paradise. As the chart shows, total new and existing home sales made a countertrend rally high in October, which was still 21% below the all-time high in July 2005. As we have noted, home price declines follow home sales declines.
The Bitcoin Crime Wave Hits
June 11, 2021 by Leave a Comment
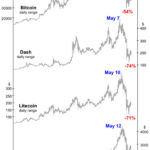
By Elliott Wave International The conviction gripping bitcoin’s ascendancy is so deep that children are now being indoctrinated into the bullish fold. We talked about this phenomenon with respect to the stock market last month. This Bloomberg column from May 16 signals its arrival in the cryptocurrency world: “Why I Pay My Seventh Grader in […]
You’re invited: Spot the Next BIG Move in Oil, Gas, Energy ETFs (April 7-14)
April 7, 2021 by Leave a Comment

Almost exactly a year ago, oil prices went negative $40. Today, with crude trading at $60, you’re hearing lots of opinions as to what’s next. “Electric car revolution” … “reopening economy” … “end of commute” … “start of travel season” … bullish … bearish … who’s right? … who’s wrong?
A Global “Debt Mountain”: Beware of This “New Peak”
March 18, 2021 by Leave a Comment
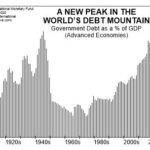
Most people going about their daily business probably never give a moment’s thought to global debt. But, in EWI’s view, the topic deserves serious attention. You only have to think back to the 2007-2009 subprime mortgage meltdown to know why. Of course, subprime mortgages are a form of debt, and when many of these loans turned sour, the entire global financial system teetered on the brink of collapse. But, why were so many of these bad loans made in the first place? It boils down to one word: confidence … confidence that the loans would be repaid, confidence that the stock market would continue to rally, confidence in the economy, and confidence in the future, in general.
Gold: See What This Fibonacci Ratio Says About the Trend
August 19, 2020 by Leave a Comment
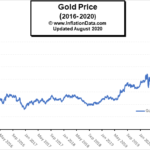
Gold has been a star performer in the markets recently with gold making a new all-time high of $2067.15 on August 6th. From there it retreated to $1931 on August 12th before resuming its climb. On August 18th it closed just above $2000 and then retreated to $1927.90 on August 19th . So we have seen quite a bit of volatility this month in gold. It certainly would be nice to know beforehand where it would stop and turn.
Stocks: Is the Worst Over or is there Worse Yet to Come?
March 28, 2020 by Leave a Comment
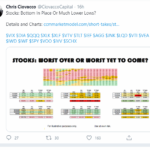
Chris Ciovacco of Ciovacco Capital Management always presents a well-reasoned approach to the market in his “short-takes” video. He emphasizes that we need to look at the preponderance of the evidence but even that doesn’t “guarantee” any future market action. All that we can do is see what has happened in the past and determine the probability that it will happen that way again. Even if 90% of the time some indicator resulted in a rise (or fall) in the market one time out of ten the opposite could still happen so we need to be prepared and listen to what the market is telling us. In Yesterday’s video Chris Ciovacco looked at volatility (i.e. the VIX) and what it is telling us regarding the current state of the market. Interestingly, recent VIX activity was actually worse than in any other crash tracked since 1990 putting it on par with the 2008 crash and in terms of volatility it was actually worse than 2008.
Junk Bonds: 2 “Golden” Junctures
March 28, 2020 by Leave a Comment
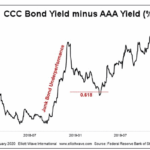
The Golden Ratio — 1.618 or .618 — is ubiquitous throughout nature. You’ll find this mathematical proportion in the shapes of galaxies, sea horses, pine cones, the arrangement of seeds on a sunflower head, and numerous other natural phenomena… including the chart patterns of financial markets.