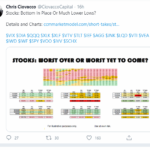
Chris Ciovacco of Ciovacco Capital Management always presents a well-reasoned approach to the market in his “short-takes” video. He emphasizes that we need to look at the preponderance of the evidence but even that doesn’t “guarantee” any future market action. All that we can do is see what has happened in the past and determine the probability that it will happen that way again. Even if 90% of the time some indicator resulted in a rise (or fall) in the market one time out of ten the opposite could still happen so we need to be prepared and listen to what the market is telling us. In Yesterday’s video Chris Ciovacco looked at volatility (i.e. the VIX) and what it is telling us regarding the current state of the market. Interestingly, recent VIX activity was actually worse than in any other crash tracked since 1990 putting it on par with the 2008 crash and in terms of volatility it was actually worse than 2008.
Junk Bonds: 2 “Golden” Junctures
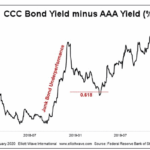
The Golden Ratio — 1.618 or .618 — is ubiquitous throughout nature. You’ll find this mathematical proportion in the shapes of galaxies, sea horses, pine cones, the arrangement of seeds on a sunflower head, and numerous other natural phenomena… including the chart patterns of financial markets.
Has the FED Hit the Launch Button for the Stock Market?
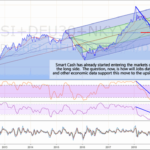
In the following article Chris tells us how the FED has ended its tightening phase which it pursued during all of 2018 and resulted in a huge market crash in the 4th quarter.
Watch This Indicator for Approaching Volatility
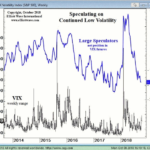
The stock market’s volatility from late July through early October was extraordinarily low. For 50 straight days the S&P 500 had not closed more than 0.8% in either direction, the longest such streak since 1968.
Yet, on October 3, all that changed. The markets dropped hard… and the VIX suddenly spiked even harder.
A Method Traders Can Use to Confirm an Elliott Wave Count
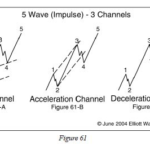
By Elliott Wave International When you are watching a pattern develop on a chart, how can you be sure that your Elliott wave count is correct? Elliott Wave International’s Senior Analyst Jeffrey Kennedy spent years designing his own technique to improve his accuracy. He came up with the Kennedy Channeling Technique, which he uses to […]
12 Real-Life Techniques That Will Make You a Better Trader Now

If you invest in the markets this is something to get excited about. Our friends at Elliott Wave International (EWI) have just released a free video-based resource, “12 Real-Life Techniques That Will Make You a Better Trader Now.” Over 5 free videos, EWI’s Master Instructor Jeffrey Kennedy gives you 12 battle-tested trading tips — 100% free.
Gold: Often, Simple Forecasting Tools Are All You Need
In the following video by Elliott Wave International we will look at the gold price and “Commitment of Traders” In 2017, Gold ‘s rally has stalled three times in April, June and August. With April and June’s price stalling at the same overhead resistance level. Back in August Elliott Wave TV said, When analyzing charts […]
Is Silver Worth Buying in 2017?
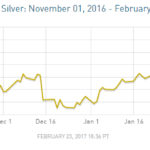
Silver investments have a sketchy past. Recently, it came to light that from 2007 to 2013 major players like JP Morgan Chase and HSBC, had been manipulating the price of silver. But that is not the first time the price of silver was manipulated. Beginning in the early 1970s, the Hunt brothers, Nelson, William and Lamar began accumulating large amounts of silver. Until his dying day in 2014, Nelson Bunker Hunt, who had once been the world’s wealthiest man, denied that he and his brothers had plotted to corner the global silver market. Whether they initially intended to “corner the market” or just believed in the ability of silver to protect against double-digit inflation is uncertain but by 1979, they had nearly cornered the global silver market.
In 1979, the brothers had made a profit of from $2 to $4 billion in silver speculation, with estimated silver holdings of 100 million troy ounces (3,100,000 kg). Because the Hunt brothers held the majority of the available above ground supply, silver prices soared from $11 an ounce in September 1979 to $50 an ounce in January 1980. However, like all bubbles this one popped as well, (in this case with the possible help of the government due to the difficulties caused by the lack of supply of silver) with prices falling back to $11 by March 1980. Eventually the Hunt brothers were forced to file for bankruptcy due to lawsuits related to their trading activities. Some see the endearingly eccentric Texans as the victims of overstepping regulators and vindictive insiders who couldn’t stand the thought of being played by a couple of southern yokels.
Even today, many investors still prefer to invest in gold rather than silver. However, 2017 is a shiny new year by many standards. Is this the year to buy silver?
Market Trends Diverging
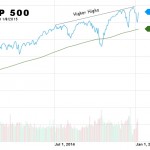
Today we are going to take a look at two common stock market charts that individually tell opposite stories but when combined give us an interesting insight into the overall market. The first chart is the S&P 500. As I’m sure you are aware the S&P 500 represents Standard and Poor’s top 500 companies.
The Plunge Protection Team Strikes Again
We have been expecting a major correction for quite some time now. In preparation for a market correction the index starts growing more slowly and then finally starts falling. Our NYSE Rate of Change (ROC) chart showed a slowing growth level and then generated a sell signal back in the first quarter of 2014. But […]
