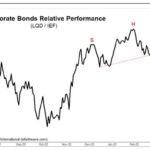
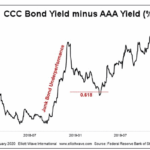
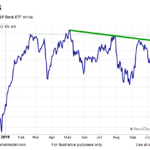
A distinct Head and Shoulders pattern exists where the neckline has been broken over the last few days. The corporate bond market has held in reasonably well over the last year, but we fully expect this sector to be the next shoe to drop.
60% stocks, 40% bonds? Ha!
Traditional wisdom suggests a quick and easy “Balanced Portfolio” of 60% stocks and 40% bonds. But there are pitfalls to this type of quick and dirty balancing. Theoretically, when stocks fall, bonds should rise or at least maintain their value. More advanced balancing systems might add a Gold or precious metals component of perhaps 10%. Still, further refinement can decrease the stock portion and increase the bond portion as you get closer to retirement age. On average, a 20-year-old has a lot longer to recover from a market downturn than an 80-year-old. So, a younger person can accept higher risk in return for a higher reward, so a 20-year-old might have 80% in stocks and 20% in bonds. An 80-year-old, on the other hand, might have 80% in Bonds and 20% in stocks. In the following article, the Editors at Elliott Wave International look at some of the pitfalls of the balanced portfolio approach. ~ Tim McMahon, editor
Why the “60 / 40 Balance” May Be Hazardous to Your Portfolio
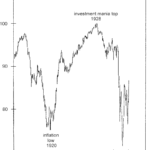
Financial advisors have long advocated a mix of 60% stocks / 40% bonds to cushion portfolios from downturns in the stock market. The thinking is that stocks go up in the long-term, hence, that’s where investors should allocate the most. At the same time, advisors acknowledge that stock prices can sometimes go down so “less risky” bonds will provide at least some protection. The problem with this investment strategy is that bonds can go into bear markets too. Moreover, they can do so at the same time as stocks. Let’s review what happened during the Great Depression of the early 1930s.
Bond Market: “When Investors Should Worry”
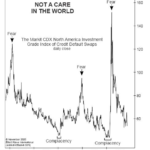
You may recall hearing a lot about “credit default swaps” during the 2007-2009 financial crisis. As a reminder, a CDS is similar to an insurance contract, providing a bond investor with protection against a default.
In the past several months, the cost of that protection has fallen dramatically. The November Elliott Wave Financial Forecast, a monthly publication which provides an analysis of major U.S. financial markets, showed this chart and said:
Junk Bonds: 2 “Golden” Junctures
The Golden Ratio — 1.618 or .618 — is ubiquitous throughout nature. You’ll find this mathematical proportion in the shapes of galaxies, sea horses, pine cones, the arrangement of seeds on a sunflower head, and numerous other natural phenomena… including the chart patterns of financial markets.
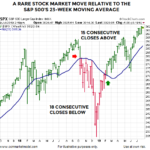
Bullish Signal Has Only Happened 10 Times in the Last 94 Years.
In today’s article by Chris Ciovacco of Ciovacco Capital Management Chris looks at a Bullish Signal that has only happened 10 times in the last 90 Years. Plus 8 charts that show a bullish break upward through resistance.
Message from the Stock/Bond Ratio
The historical cases told us to be open to a period marked by bond underperformance relative to the stock market. Thus, it might be helpful to revisit the stock vs. bond topic as we near the end of July.
Key Charts For Fed Day
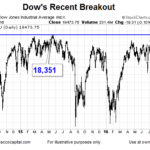
A retest of prior resistance may be in the cards, which is exactly what happened in early 1995. In 2016, the Dow Jones Industrial Average (below) may be in retest mode.
Bonds Continue To Flash Warning Signs For Stocks
When investors are fearful, common sense tells us demand picks up for more conservative assets, which is exactly what happened early Monday morning. When investors are very pessimistic and fearful, return of principal becomes highly important. Therefore, when fear increases we would expect to see defensive bonds outperform growth-oriented stocks.
Floating-Rate Funds Poised to Profit as Interest Rates Rise
Typically, as I’m sure you are aware interest rates and bond prices have an inverse relationship. That means when interest rates rise bond prices fall. But in today’s article we will look at a different type of bond fund that avoids that type of risk.
