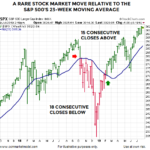
In today’s article, Chris Ciovacco looks at a few new signals, one has occurred 8 previous times, one occurred 5 previous times and one rare event that has only occurred three previous times in the last 90 years! He will also look at how stocks performed in all of those cases, looking out both months and several years.
Bull Trap or Market Consolidation?
At the end of last week, Chris Ciovacco recorded his weekly “Short-Takes” market analysis, and overall, things looked quite bullish. Most markets were above their moving averages, trends were turning up, and things were looking good. And then this week, markets turned down, and things got gloomier. But as we’ve said before, Stocks Don’t Go Straight Up (or Straight Down), and Chris said last week that he wouldn’t be surprised to see the markets like the S&P 500 retest the 3900-3950 levels. This is all part of a healthy consolidation. Of course, if markets fall below certain levels, we must reevaluate our position and see if the 2023 rally was just a “Bull Trap” after all. We should remember that the FED is still tightening, and we know “fighting the FED” is generally a bad idea.
Why Investors are Consistently Fooled by the Stock Market
Stock market observers are trying to “make sense” of the wild price moves, which have mainly been to the downside.
As a May 12 CNBC headline says:
Traders search for answers as relentless selling on Wall Street looks to be detached from reality
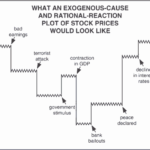
Many market participants believe the “reality” of economic statistics, earnings and other factors external to the market govern the market’s trend.
However, that’s a fallacy.
Let’s get insights from a classic Elliott Wave Theorist, a monthly publication which provides analysis of financial markets and social trends:
Market Participants are Extremely Bullish
With the current political upheaval in this country, it is difficult to see how the market can be so bullish. In today’s article by Elliott Wave International, we see that the market has “Great Expectations” for 2021. But as we saw in the previous article, Why Most Investors Miss Major Stock Market Turns, often when market-participants are most bullish is at the peak. And its not just amateurs that make this mistake, even “professionals” get caught up in the euphoria. This makes sense in a strange sort of way. When everyone is “fully invested” there is no more money left to flow into the market so it has to go down. And when everyone has taken their money out of the market and put it in “safe cash” there is plenty of money available to drive the market up. Recently Forbes published an article entitled 4 Stock Market Sentiment Indicators: Euphoric-Plus. The old market adage “when everyone else is buying you should be selling” might apply here. Also at the end of this article, you can get free access to the online version (really free- no shipping) of the Elliott Wave Classic, Elliott Wave Principle: Key to Market Behavior ~Tim McMahon, editor
Stocks: Is the Worst Over or is there Worse Yet to Come?
Chris Ciovacco of Ciovacco Capital Management always presents a well-reasoned approach to the market in his “short-takes” video. He emphasizes that we need to look at the preponderance of the evidence but even that doesn’t “guarantee” any future market action. All that we can do is see what has happened in the past and determine the probability that it will happen that way again. Even if 90% of the time some indicator resulted in a rise (or fall) in the market one time out of ten the opposite could still happen so we need to be prepared and listen to what the market is telling us. In Yesterday’s video Chris Ciovacco looked at volatility (i.e. the VIX) and what it is telling us regarding the current state of the market. Interestingly, recent VIX activity was actually worse than in any other crash tracked since 1990 putting it on par with the 2008 crash and in terms of volatility it was actually worse than 2008.
Message from the Stock/Bond Ratio
The historical cases told us to be open to a period marked by bond underperformance relative to the stock market. Thus, it might be helpful to revisit the stock vs. bond topic as we near the end of July.
Do Facts Support Doom and Gloom or Higher Highs for Stocks and/or Gold?
Dating back to 1950, the S&P 500 has only dropped over 40% three times: 1973-74, 2000-02, and 2007-09. In each case after the big drop, something caused investors to change their attitude and behavior related to the attractiveness of common stocks. Major lows are rare and the shifts that occur in the minds of human beings near major lows are rare. History tells us valuable information can be found in rare market events.
Is the Falling Trade Deficit Good for Stocks?
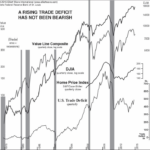
If the Balance of Trade is Negative i.e. Imports are greater than Exports a country will have a net outflow of currency and theoretically it will go broke. However, over the years the U.S. has been able to maintain a negative balance of trade by borrowing money from other countries i.e. selling them Treasury Bills, Bonds and Notes. So they give us money to buy stuff from them. On March 27, CNBC said that “the U.S. trade deficit fell much more expected in January to $51.15 billion, from a forecast $57 billion. The decline of 14.6 percent represented the sharpest drop since March 2018…” You would think this would be good for our economy as we are producing more and borrowing less. But it could also mean that we are buying less because our buyers have less money to spend. Conventional wisdom says that a falling trade deficit is good for stocks.There are many widely held beliefs about the stock market that are unverified, questionable or simply untrue. Even professional market observers often neglect to investigate these widely held beliefs for themselves — and their clients. Consider the claim that a falling trade deficit is good for stocks, and vice versa. In this article from Elliott Wave International they look at the relationship between a falling trade deficit and the stock market.
Has the FED Hit the Launch Button for the Stock Market?
In the following article Chris tells us how the FED has ended its tightening phase which it pursued during all of 2018 and resulted in a huge market crash in the 4th quarter.
Reversals And Counter-trend Moves Typically Take Time To Develop
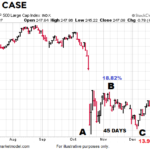
Since investor psychology tends to be similar after a sharp plunge in the stock market, subsequent bottoms and/or countertrend rallies often share similar characteristics… making determining which is which more difficult.
