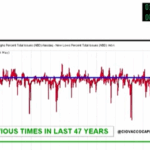
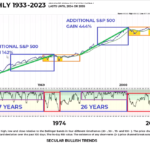
In the following video by Chris Ciovacco, he looks at a Stock Market Signal that has only occurred three times in the last 47 years.
Extremely Rare Market Signal Just Triggered
In today’s article, Chris Ciovacco looks at a few new signals, one has occurred 8 previous times, one occurred 5 previous times and one rare event that has only occurred three previous times in the last 90 years! He will also look at how stocks performed in all of those cases, looking out both months and several years.
The Market is Currently a “Mixed Bag”
In the following video, Chris Ciovacco of Ciovacco Capital Management looks at several market indicators and the recent rebound.
Repeating Patterns = Profit Potential
As shown in the charts, the S&P 500 performed quite well walking forward from February 1, 2013 and December 9. 2016, both periods are similar to December 23, 2019, which tells us to remain open to better than expected outcomes in 2020.
The Beginning of a Long-Term “Secular” Bull Market?
In the following article, Chris Ciovacco of Ciovacco Capital Management takes a look at the mood of the common investor as the outflows of equity funds reach new levels of pessimism. These levels are actually more pessimistic than in July 2016 when everyone was convinced that Hillary was going to be elected. They are even more pessimistic than at the depths of despair in March 2009 after the beginning of the “Great Recession”. So what is going on? ~ Tim McMahon, editor.
What Does this Rare & Rapid Drop in Manufacturing Mean?
Purchasing managers are in a great position to judge the state of the economy (at least as far as their company goes). They know how much they sold last month, how much they expect to sell this month, year-ago sales, etc. What if you could aggregate all this information and develop an index that tells you where the economy is going? Well, that is exactly what the ISM Manufacturing index does and it has been around for over 100 years (since 1915 to be exact). So what is the ISM index currently telling us?
Bullish Signal Has Only Happened 10 Times in the Last 94 Years.
In today’s article by Chris Ciovacco of Ciovacco Capital Management Chris looks at a Bullish Signal that has only happened 10 times in the last 90 Years. Plus 8 charts that show a bullish break upward through resistance.
Trade, Impeachment, and the Conviction of Buyers and Sellers
The following article by Chris Ciovacco looks at the impact the possibility of impeachment is having and could have on the stock market.
History Says Stocks Can Perform Well After Big Oil Shocks
“Stocks fell on Monday amid fears that a surge in oil prices following an attack in Saudi Arabia could slow down global economic growth.” Thus, it may be helpful to know how stocks have performed after big one-day spikes in the price of oil. Charlie Bilello’s Twitter feed (@CharlieBilello) contains dates of the largest one-day spikes in the price of oil (1983-2019).
Almost Inverted Yield Dip Is Bullish for Stocks
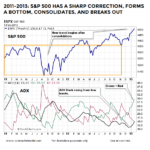
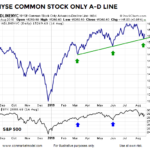
During the trading session on Monday, August 19, the “bottoming process” case for the stock market remained intact. The NYSE Common Stock A-D Line held the line last week at a logical level associated with the S&P 500 reversals in March and June (chart below).
