The historical cases told us to be open to a period marked by bond underperformance relative to the stock market. Thus, it might be helpful to revisit the stock vs. bond topic as we near the end of July.
Do Facts Support Doom and Gloom or Higher Highs for Stocks and/or Gold?
July 25, 2019 by Leave a Comment
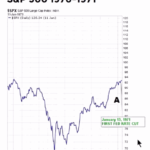
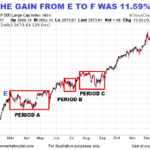
Dating back to 1950, the S&P 500 has only dropped over 40% three times: 1973-74, 2000-02, and 2007-09. In each case after the big drop, something caused investors to change their attitude and behavior related to the attractiveness of common stocks. Major lows are rare and the shifts that occur in the minds of human beings near major lows are rare. History tells us valuable information can be found in rare market events.
What Typically Happens When These Charts Flip?
June 21, 2019 by Leave a Comment
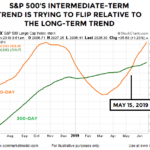
In today’s article Chris Ciovacco looks at several charts with their 100 day and 300 day moving averages and what happens when those averages ‘cross”.
Are Rate Cuts a “Death Knell” for Stocks?
June 15, 2019 by Leave a Comment
There has been some talk in the media lately about the effects of FED rate cuts on the stock market. Conventional wisdom says that the FED begins cutting rates when it fears a contraction in the economy is coming. This is because it is afraid if it waits too long to cut rates it will “get behind the curve” and then cuts will not be effective. So when the FED cuts rates for the first time after a period of raising rates that must mean that the FED fears a recession coming on (which is bad for stocks). So, the question we are going to look at today is whether the facts actually bear out this conclusion. In today’s video Chris Ciovacco analyzes the FED rate cuts and how the situation relates to the current economic climate.
The Long-Term Message from the VIX
April 17, 2019 by Leave a Comment
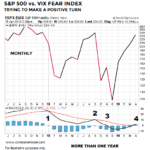
The VIX measures the market’s expectation of future volatility. We can think of the S&P 500/VIX ratio as a way to track confidence in stocks and earnings relative to confidence the market will be volatile. The S&P 500/VIX ratio is currently in the process of trying to complete a relatively rare longer-term shift.
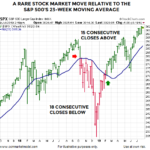
NASDAQ Signal Has Only Occurred 15 Times In Last 42 Years
March 27, 2019 by Leave a Comment
Fifteen times in Forty-Two years is about once every 8½ years. That makes it a relatively rare occurrence. In today’s video, Chris Ciovacco of Ciovacco Capital Management looks at the recent MACD cross. The first MACD cross which occurred in September 2018 reveals the beginning of a countertrend movement in the prevailing uptrend. But when the “black” MACD line crossed below the zero line in November we get what looks like a confirmation of the switch from a countertrend movement to a full downtrend movement.
But on March 8th 2019, we see the “black” MACD line crossing back above the zero line. Thus we see the relatively rare signal as follows, “MACD crosses below the centerline on a weekly closing basis and stays below for at least 3.5 to 4 months, and then closes back above the zero line”… this makes it look more like a new uptrend rather than a countertrend rally.
Reversals And Counter-trend Moves Typically Take Time To Develop
January 10, 2019 by Leave a Comment
Since investor psychology tends to be similar after a sharp plunge in the stock market, subsequent bottoms and/or countertrend rallies often share similar characteristics… making determining which is which more difficult.
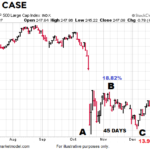
1987 vs. 2018
October 26, 2018 by Leave a Comment
Typically, investors see October as a tough month for the Stock market with “The Panic of 1907 (October 1907)”, Black Tuesday, Thursday and Monday (October 1929), and Black Monday (October 1987). But according to Investopedia September is actually just as bad with Black Friday (September 1869), Black Wednesday i.e. September 16, 1992, when the pound sterling crashed forcing Britain to withdraw from the European Exchange Rate Mechanism (ERM). September 2001 and 2008 each had single day point declines in the Dow that were bigger than Black Monday October 1987. A 2014 Business insider article stated that “the Dow October average over this timeframe is a modest 0.20%. There have been 64 monthly gains and 49 monthly losses. That’s calculates as a gain about 57% of the time.” The following article by Chris Ciovacco of Ciovacco Capital Management compares market action in October 1987 to October 2018.
The Psychology of Volatility
October 9, 2018 by Leave a Comment
Nobody likes minus signs and red screens, which create a feeling of being out of control. While hitting a sell button can make us feel like we are back in control, it often leads to overtrading and disappointing returns.
What is the Up/Down Volume Saying About the Current Market?
September 20, 2018 by Leave a Comment
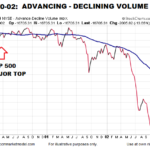
By looking at previous bear markets we can get an idea about how advance/decline volume behaves in bear markets. When the S&P 500 reached a bull/bear tipping point in March 2000, NYSE Advancing – Declining Volume was already waving yellow flags. As shown in the chart below, $NYUD was hugging its 50-week moving average and the 50-week was rolling over in a bearish manner.