The following article by Chris Ciovacco looks at the impact the possibility of impeachment is having and could have on the stock market.
Almost Inverted Yield Dip Is Bullish for Stocks
August 19, 2019 by Leave a Comment
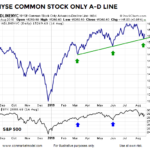
During the trading session on Monday, August 19, the “bottoming process” case for the stock market remained intact. The NYSE Common Stock A-D Line held the line last week at a logical level associated with the S&P 500 reversals in March and June (chart below).
Message from the Stock/Bond Ratio
August 1, 2019 by 2 Comments
The historical cases told us to be open to a period marked by bond underperformance relative to the stock market. Thus, it might be helpful to revisit the stock vs. bond topic as we near the end of July.
Do Facts Support Doom and Gloom or Higher Highs for Stocks and/or Gold?
July 25, 2019 by Leave a Comment
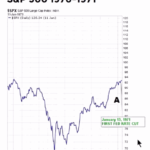
Dating back to 1950, the S&P 500 has only dropped over 40% three times: 1973-74, 2000-02, and 2007-09. In each case after the big drop, something caused investors to change their attitude and behavior related to the attractiveness of common stocks. Major lows are rare and the shifts that occur in the minds of human beings near major lows are rare. History tells us valuable information can be found in rare market events.
What Typically Happens When These Charts Flip?
June 21, 2019 by Leave a Comment
In today’s article Chris Ciovacco looks at several charts with their 100 day and 300 day moving averages and what happens when those averages ‘cross”.
Are Rate Cuts a “Death Knell” for Stocks?
June 15, 2019 by Leave a Comment
There has been some talk in the media lately about the effects of FED rate cuts on the stock market. Conventional wisdom says that the FED begins cutting rates when it fears a contraction in the economy is coming. This is because it is afraid if it waits too long to cut rates it will “get behind the curve” and then cuts will not be effective. So when the FED cuts rates for the first time after a period of raising rates that must mean that the FED fears a recession coming on (which is bad for stocks). So, the question we are going to look at today is whether the facts actually bear out this conclusion. In today’s video Chris Ciovacco analyzes the FED rate cuts and how the situation relates to the current economic climate.
Is War Good for Stocks?
May 30, 2019 by Leave a Comment
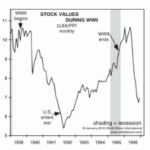
Many people believe that “War is good for Stocks” because the government pumps billions into the economy thus creating jobs and those new employees spend money having a multiplying effect on the economy. And when the economy booms the stock market booms right? In the following chart we can see that shortly after the U.S. entered WWII that the stock market began rising and it continued to rise throughout the remainder of the war. This is possibly why U.S. investors have come to believe that “War is Good for the Market”. But…
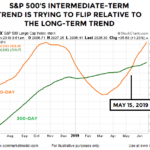
NASDAQ Signal Has Only Occurred 15 Times In Last 42 Years
March 27, 2019 by Leave a Comment
Fifteen times in Forty-Two years is about once every 8½ years. That makes it a relatively rare occurrence. In today’s video, Chris Ciovacco of Ciovacco Capital Management looks at the recent MACD cross. The first MACD cross which occurred in September 2018 reveals the beginning of a countertrend movement in the prevailing uptrend. But when the “black” MACD line crossed below the zero line in November we get what looks like a confirmation of the switch from a countertrend movement to a full downtrend movement.
But on March 8th 2019, we see the “black” MACD line crossing back above the zero line. Thus we see the relatively rare signal as follows, “MACD crosses below the centerline on a weekly closing basis and stays below for at least 3.5 to 4 months, and then closes back above the zero line”… this makes it look more like a new uptrend rather than a countertrend rally.
Traders Should Stay Optimistically Cautious
February 20, 2019 by Leave a Comment
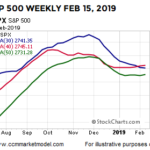
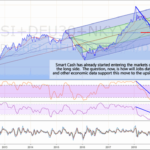
So far, the research team, at The Technical Trades Ltd., has been calling this market move quite accurately. On September 17, 2018, they called for a -5~8% downside market rotation, followed by price support just before the November 2018 US elections. After that, they called for a deep “Ultimate Low” price rotation followed by a strong price rally. Even though they under-estimated the depth of the correction their trend predictions from 120 days earlier played out quite accurately. So here is what they are currently saying.
Has the FED Hit the Launch Button for the Stock Market?
February 5, 2019 by Leave a Comment
In the following article Chris tells us how the FED has ended its tightening phase which it pursued during all of 2018 and resulted in a huge market crash in the 4th quarter.