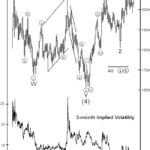
Gold’s three-month implied volatility has declined to its lowest level in over four years. While low volatility is not a short term timing tool, low volatility eventually precedes high volatility. At the same time, total open interest in gold futures has declined to its lowest level since December 2018, as traders are either closing futures contracts or abstaining from opening new ones. The low level of open interest means that investors’ attention is turning away from gold, and the low implied volatility indicates that investors do not expect gold to move much over the course of the next three months. Both are preludes to what we see as a major move forming in gold prices.
Stocks: Is the Worst Over or is there Worse Yet to Come?
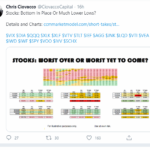
Chris Ciovacco of Ciovacco Capital Management always presents a well-reasoned approach to the market in his “short-takes” video. He emphasizes that we need to look at the preponderance of the evidence but even that doesn’t “guarantee” any future market action. All that we can do is see what has happened in the past and determine the probability that it will happen that way again. Even if 90% of the time some indicator resulted in a rise (or fall) in the market one time out of ten the opposite could still happen so we need to be prepared and listen to what the market is telling us. In Yesterday’s video Chris Ciovacco looked at volatility (i.e. the VIX) and what it is telling us regarding the current state of the market. Interestingly, recent VIX activity was actually worse than in any other crash tracked since 1990 putting it on par with the 2008 crash and in terms of volatility it was actually worse than 2008.
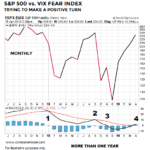
The Long-Term Message from the VIX
The VIX measures the market’s expectation of future volatility. We can think of the S&P 500/VIX ratio as a way to track confidence in stocks and earnings relative to confidence the market will be volatile. The S&P 500/VIX ratio is currently in the process of trying to complete a relatively rare longer-term shift.
Watch This Indicator for Approaching Volatility
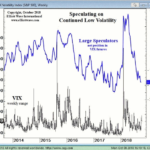
The stock market’s volatility from late July through early October was extraordinarily low. For 50 straight days the S&P 500 had not closed more than 0.8% in either direction, the longest such streak since 1968.
Yet, on October 3, all that changed. The markets dropped hard… and the VIX suddenly spiked even harder.
The Psychology of Volatility
Nobody likes minus signs and red screens, which create a feeling of being out of control. While hitting a sell button can make us feel like we are back in control, it often leads to overtrading and disappointing returns.
Charts Say Stocks Could Rise For 10-15 Years
With busy lives and a constant barrage of new information, many investors have a somewhat limited view of history from a financial markets/economic/political perspective. Albert Einstein reminds us of the benefits of taking a step back to review the bigger picture in a longer-term historical context:
“Somebody who only reads newspapers and at best books of contemporary authors looks to me like an extremely nearsighted person who scorns eyeglasses. He is completely dependent on the prejudices and fashions of his times, since he never gets to see or hear anything else.” Albert Einstein
Warning: Fast Moving Market
As volatility decreases people get complacent and get in a rut things become “normal” and so they are less alert to the bear around the next corner waiting to maul them. In today’s article Jared Dillian, editor of Bull’s Eye Investor, looks at the effects this complacency can have on your investments.
