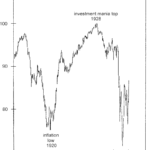
Financial advisors have long advocated a mix of 60% stocks / 40% bonds to cushion portfolios from downturns in the stock market. The thinking is that stocks go up in the long-term, hence, that’s where investors should allocate the most. At the same time, advisors acknowledge that stock prices can sometimes go down so “less risky” bonds will provide at least some protection. The problem with this investment strategy is that bonds can go into bear markets too. Moreover, they can do so at the same time as stocks. Let’s review what happened during the Great Depression of the early 1930s.
Is the Correction Over?
January 27, 2022 by Leave a Comment
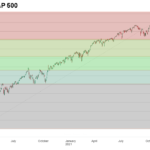
After a fairly rapid correction in January 2022, the market has started to rebound. So does that mean it’s safe to jump back into the market? After all, we saw a worse crash in January 2020 followed by a rapid rebound to new highs. And even the 2018 correction was short-lived. So have market participants become accustomed to quick rebounds? Or is this just a brief counter-trend rally?
Has Crypto-Mania Finally Run Its Course?
December 14, 2021 by Leave a Comment
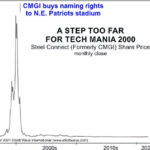
Typically when a Company gets naming rights to a sports stadium or their President gets to ring the bell at the New York Stock Exchange that company is at the top of its game. Unfortunately, when you are at the top there is nowhere to go but down. In today’s article, we are going to look at tops, tech, crypto, and stadiums.
Why a Financial “Panic” May Be Just Around the Corner
September 29, 2021 by Leave a Comment
Over the last few months, we’ve been warning that caution is the word of the day. The market was concerned that the FED’s September Statement would include provisions for tightening. That doesn’t seem to be their stance for the near future at least. But that doesn’t mean that the market is going to skyrocket either. As we can see in the following chart of the NYSE, the market definitely leveled off over the summer (despite the FED pumping $120 billion per month into the economy).
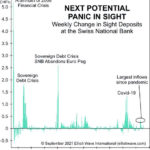
There’s one indicator that many investors overlook, and that’s the weekly change in “sight deposits” at the Swiss National Bank. This chart helps show when a financial panic could be building.
High “Beta” stocks … “Meme” stocks… and Index stocks… Oh My!
July 12, 2021 by Leave a Comment
High “Beta” stocks tend to move in the same direction as the overall market but at a multiple of the overall index. So for instance, if the overall market is up 2% a high beta stock might be up 3% or 5%, or even 10%. “Meme” stocks are those that have gotten a lot of publicity on Social Media and also tend to be high beta stocks as well. Index stocks are those that make up a particular index and are often most volatile when first added or removed from an index. Today’s article covers the convergence of all of these three factors on June 25th.
The Fear of Missing Out
June 23, 2021 by Leave a Comment

The fear of missing out (FOMO) is a powerful narcotic that often affects market participants near the top of a cycle. And before long, you hear the “bag-boy” at the supermarket bragging about his “portfolio”. When that happens it is time to follow Warren Buffet’s sage advice and “Be fearful when everyone else is greedy and greedy when everyone else is fearful.”
The Bitcoin Crime Wave Hits
June 11, 2021 by Leave a Comment
By Elliott Wave International The conviction gripping bitcoin’s ascendancy is so deep that children are now being indoctrinated into the bullish fold. We talked about this phenomenon with respect to the stock market last month. This Bloomberg column from May 16 signals its arrival in the cryptocurrency world: “Why I Pay My Seventh Grader in […]
Are Investors “Courting Doom”?
April 29, 2021 by Leave a Comment
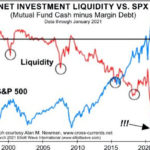
Since the start of the pandemic, millions of people have opened trading accounts. Perhaps, you have as well. When stocks only go up – as they have over the past year – trading seems easy. That’s why many traders today use lots of margin debt. And why not? Borrowing to buy stocks can work out well during an uptrend. Yet, highly leveraged portfolios can be deeply wounded during a fast-moving downtrend. When this bull run ends, we’ll hear lots of stories about traders who got caught completely unprepared. Don’t let it happen to you.
Too Many Bulls?
April 20, 2021 by Leave a Comment
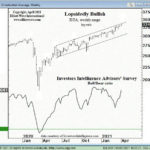
We know from experience that whenever investor sentiment gets too lopsided — in other words, if there are “too many” bulls or “too many” bears — it inevitably means that a market reversal is near. Back in January, we ran an article on the extreme bullishness of the market and then we saw a correction but it didn’t last long enough and once again we are looking at a bullish etreme. Today we are bringing you an article from Elliott Wave International which looks at how bullish the current market is.
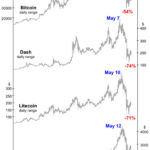
Bitcoin: Let’s Put 2 Heart-Pounding Price Drops into Perspective
February 27, 2021 by Leave a Comment
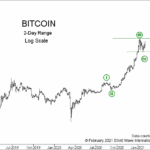
Bitcoin’s price fell hard, from above $58,000 to $45,000, and some are wondering if this is the start of a crash. Well, the word “crash” was also used back in January, when the cryptocurrency fell from $42,000 to below $30,000. However, prices bounced back. Let’s see how Elliott wave analysis can help put both price drops into perspective.