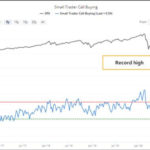
With the current political upheaval in this country, it is difficult to see how the market can be so bullish. In today’s article by Elliott Wave International, we see that the market has “Great Expectations” for 2021. But as we saw in the previous article, Why Most Investors Miss Major Stock Market Turns, often when market-participants are most bullish is at the peak. And its not just amateurs that make this mistake, even “professionals” get caught up in the euphoria. This makes sense in a strange sort of way. When everyone is “fully invested” there is no more money left to flow into the market so it has to go down. And when everyone has taken their money out of the market and put it in “safe cash” there is plenty of money available to drive the market up. Recently Forbes published an article entitled 4 Stock Market Sentiment Indicators: Euphoric-Plus. The old market adage “when everyone else is buying you should be selling” might apply here. Also at the end of this article, you can get free access to the online version (really free- no shipping) of the Elliott Wave Classic, Elliott Wave Principle: Key to Market Behavior ~Tim McMahon, editor
Bond Market: “When Investors Should Worry”
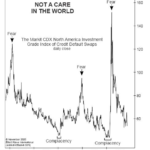
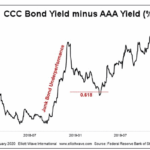
You may recall hearing a lot about “credit default swaps” during the 2007-2009 financial crisis. As a reminder, a CDS is similar to an insurance contract, providing a bond investor with protection against a default.
In the past several months, the cost of that protection has fallen dramatically. The November Elliott Wave Financial Forecast, a monthly publication which provides an analysis of major U.S. financial markets, showed this chart and said:
Gold: See What This Fibonacci Ratio Says About the Trend
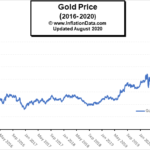
Gold has been a star performer in the markets recently with gold making a new all-time high of $2067.15 on August 6th. From there it retreated to $1931 on August 12th before resuming its climb. On August 18th it closed just above $2000 and then retreated to $1927.90 on August 19th . So we have seen quite a bit of volatility this month in gold. It certainly would be nice to know beforehand where it would stop and turn.
Emerging Markets and Epidemics
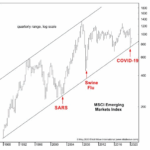
The global disruption associated with the pandemic far surpasses other major health scares in modern history.
Even so, you may recall 2009 news articles similar to this one from the New York Times (June 11, 2009):
It came as no surprise [on June 11, 2009] when the World Health Organization declares that the swine flu outbreak had become a pandemic.
The disease has reached 74 countries …
And, going further back in time, the World Health Organization provided this July 5, 2003 update on the Severe Acute Respiratory Syndrome, known as SARS:
To date, 8439 people have been affected, and 812 have died from SARS.
The reason for briefly reviewing the swine flu and SARS is to point out that, as surprising as it may be, both outbreaks marked not the start, but the end of a downtrend in emerging markets stocks.
Stocks: Is the Worst Over or is there Worse Yet to Come?
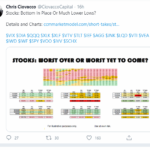
Chris Ciovacco of Ciovacco Capital Management always presents a well-reasoned approach to the market in his “short-takes” video. He emphasizes that we need to look at the preponderance of the evidence but even that doesn’t “guarantee” any future market action. All that we can do is see what has happened in the past and determine the probability that it will happen that way again. Even if 90% of the time some indicator resulted in a rise (or fall) in the market one time out of ten the opposite could still happen so we need to be prepared and listen to what the market is telling us. In Yesterday’s video Chris Ciovacco looked at volatility (i.e. the VIX) and what it is telling us regarding the current state of the market. Interestingly, recent VIX activity was actually worse than in any other crash tracked since 1990 putting it on par with the 2008 crash and in terms of volatility it was actually worse than 2008.
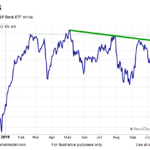
Junk Bonds: 2 “Golden” Junctures
The Golden Ratio — 1.618 or .618 — is ubiquitous throughout nature. You’ll find this mathematical proportion in the shapes of galaxies, sea horses, pine cones, the arrangement of seeds on a sunflower head, and numerous other natural phenomena… including the chart patterns of financial markets.
Is the Buying Opportunity Here Yet?
With the market down so sharply many are speculating that it will rebound just as sharply but market sentiment might be indicating something else altogether.
Did the Oil Crash Wreck the Stock Market?
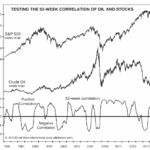
Crude oil took a 30% dive on Sunday, March 8. Yet what’s happened in oil this year is so much bigger than that headline-grabbing, one-day move. In January, oil was $64 a barrel. It hit $27.34 intraday on Monday, March 9, so the price of oil fell 57% in just two months. Talk about a swift decline.
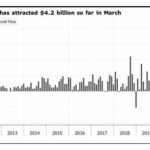
The Beginning of a Long-Term “Secular” Bull Market?
In the following article, Chris Ciovacco of Ciovacco Capital Management takes a look at the mood of the common investor as the outflows of equity funds reach new levels of pessimism. These levels are actually more pessimistic than in July 2016 when everyone was convinced that Hillary was going to be elected. They are even more pessimistic than at the depths of despair in March 2009 after the beginning of the “Great Recession”. So what is going on? ~ Tim McMahon, editor.
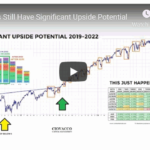
Bullish Signal Has Only Happened 10 Times in the Last 94 Years.
In today’s article by Chris Ciovacco of Ciovacco Capital Management Chris looks at a Bullish Signal that has only happened 10 times in the last 90 Years. Plus 8 charts that show a bullish break upward through resistance.