How to Build Consistent Trading Success

You’ve heard it all before:

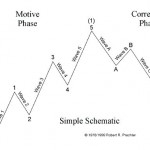
If you want to trade using Elliott wave analysis, to succeed you first need to understand its rules and guidelines.
You need a clearly defined trading strategy (what? when? how? etc.) and the discipline to follow it.
Additionally, your long-term success depends on adequate capitalization, money management skills and emotional self-control.
Do you meet these qualifications, yet still struggle in the markets? If so, you may find some helpful advice in this quick trading lesson from Trader’s Classroom editor, Jeffrey Kennedy:

Reversals And Counter-trend Moves Typically Take Time To Develop

Since investor psychology tends to be similar after a sharp plunge in the stock market, subsequent bottoms and/or countertrend rallies often share similar characteristics… making determining which is which more difficult.

Watch This Indicator for Approaching Volatility

The stock market’s volatility from late July through early October was extraordinarily low. For 50 straight days the S&P 500 had not closed more than 0.8% in either direction, the longest such streak since 1968.
Yet, on October 3, all that changed. The markets dropped hard… and the VIX suddenly spiked even harder.

1987 vs. 2018

Typically, investors see October as a tough month for the Stock market with “The Panic of 1907 (October 1907)”, Black Tuesday, Thursday and Monday (October 1929), and Black Monday (October 1987). But according to Investopedia September is actually just as bad with Black Friday (September 1869), Black Wednesday i.e. September 16, 1992, when the pound sterling crashed forcing Britain to withdraw from the European Exchange Rate Mechanism (ERM). September 2001 and 2008 each had single day point declines in the Dow that were bigger than Black Monday October 1987. A 2014 Business insider article stated that “the Dow October average over this timeframe is a modest 0.20%. There have been 64 monthly gains and 49 monthly losses. That’s calculates as a gain about 57% of the time.” The following article by Chris Ciovacco of Ciovacco Capital Management compares market action in October 1987 to October 2018.

BITCOIN BREAKDOWN MAY PUSH PRICES BELOW $5000

Recent market turmoil across the global stock markets has refocused investors on the concerns of global economics, trade, and geopolitical issues – away from cryptocurrencies.  The biggest, Bitcoin, has been under extended pricing pressure recently and our research team believes Bitcoin will breach the $6000 level to the downside fairly quickly as extended global market downtrends continue.

The Psychology of Volatility

Nobody likes minus signs and red screens, which create a feeling of being out of control. While hitting a sell button can make us feel like we are back in control, it often leads to overtrading and disappointing returns.

This Doesn’t Happen in Bear Markets

When the stock market peaked in late January, many hypothesized it was the beginning of a long-term bear market.  As shown in the S&P 500 monthly chart below, stocks posted red months in February and March, and went on to post gains for five consecutive months.  The green months in April, May, June, July, and August mean the S&P 500 posted gains in 11 of the last 13 months.

Is Gold on the Verge of a Bottom?

From 2017 until now the Gold chart shows another 75% price retracement from recent highs once again.  This second 75% retracement could be a massive bottom formation setting up in Gold and could be a huge “wash-out” low price.  We believe this unique retracement is indicative of a massive price breakout over the next year or so as the price of gold is forming what Stan Weinstein calls a Stage 1 Accumulation.

Charts Say Stocks Could Rise For 10-15 Years

With busy lives and a constant barrage of new information, many investors have a somewhat limited view of history from a financial markets/economic/political perspective.  Albert Einstein reminds us of the benefits of taking a step back to review the bigger picture in a longer-term historical context:

“Somebody who only reads newspapers and at best books of contemporary authors looks to me like an extremely nearsighted person who scorns eyeglasses. He is completely dependent on the prejudices and fashions of his times, since he never gets to see or hear anything else.” Albert Einstein

Latest Economic Data Doesn’t Align with Yield Curve Fears

According to numerous articles, a flattening yield curve nearing the zero boundary is a major red flag for stocks and the economy. But…